As you may have seen from the title, this article's about Google Analytics - a tool I strongly encourage any developers, bloggers or anyone to use!
Why Should You Learn Google Analytics?
Google Analytics provide free measurement tools to track and learn about your website through data and analysis. It gives useful insights on your website's:
- Audience (i.e. demographics, location, source, etc.)
- Acquisition (i.e. traffic sources, medium, ad campaigns, etc.)
- Site Behaviour (i.e. flow, content, search, events, etc.)
- Goals (i.e. conversions, channels, etc.)
Collecting data and analyzing them can help you gain a deeper understanding about your website and help you slowly grow your website to its full potential! Numbers don't lie.
If you own a blog, this can be useful to help grow your reader base or email newsletter subscribers. If you own a business website, this can help you with your digital marketing plans and increasing online traffic for sales. In short, integrating this tool into your website and learning how to use it will allow you to reap plenty of benefits at no cost at all. What could be better than that?
How I Learned Google Analytics
Over the weekend, I enrolled in Google Analytics Academy to learn the tool. It sounds like a really fancy school, isn't it? But it is not haha, you easily can sign up for free here and take online courses on Google Analytics.
I spent a few hours to learn, took the certification exam and now, I am a proud graduate! I suggest you go for it too.

But if you don't have time, don't worry. In this post, I present you a guide on the most useful things you need to know as a beginner in Google Analytics.
Note that this guide is only covers the basic essentials, you can enroll in the academy and dig deeper on this tool yourself to help achieve specific goals for your website.
1. Integrating Google Analytics
Step 1: Create an analytics account
Head over to https://analytics.google.com/analytics/web/ and sign up for an account.
Then, you should see the page below.
Go ahead and click the 'Start measuring' button.

Step 2: Create an account and property
Now, you will be asked to create an account. Don't mistake it for the same as step 1. This account refers to a group of websites that you want to track.
For example, you might want an account for all your personal websites and an account for all your business websites. It helps to separate and organize your websites into accounts. Both these accounts are under your single Google Analytics account.
In this example, we can name our account 'Personal' to track our personal website and blog.

Then click the option to measure 'Web'.

Finally, fill in the appropriate details for your property (i.e. website) under that account. Accept its Terms and Agreement.

Step 3A: Integrate into Hashnode
After step 2, you will see:

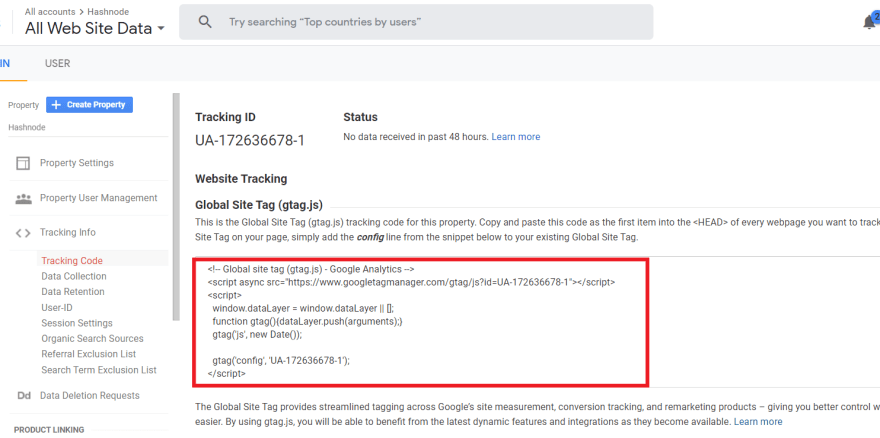
If for some reason you are not on this page, simply head over to Admin > Property Window > Tracking Info > Tracking Code.
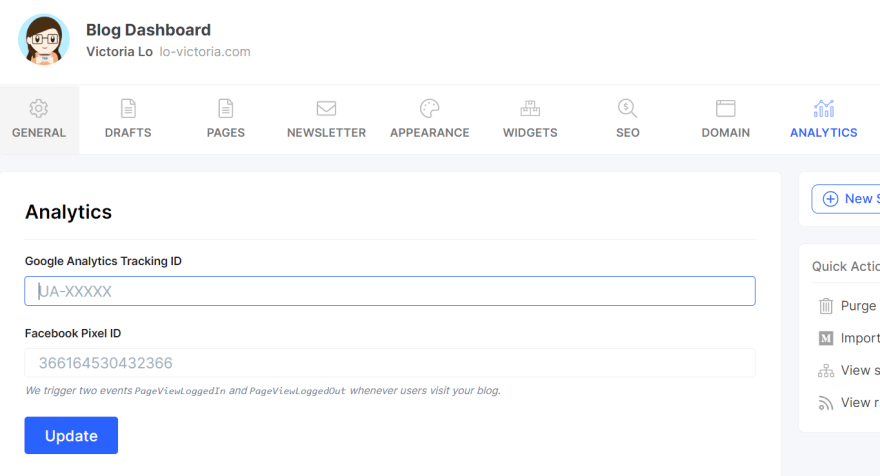
Copy the tracking ID and head over to your Hashnode's Blog Dashboard > Analytics. Paste the tracking ID under Google Analytics, click 'Update' and you are done!
In 24 hours, Google Analytics will have collected some data on your site and you will see some numbers on your analytics account.
Step 3B: Integrate into a personal website
In case you want to track a personal website, you can do the following. Go to the same page as the tracking ID, copy the gtag.js and paste this code as the first item into the head of the webpage you want to track.
And that's how you can integrate analytics into your websites! Pretty simple right?
2. Essential Statistics to Know
Now that we have Google Analytics in our website, we need to be able to read data in order to analyze and interpret them. Here are some common statistics you will encounter that are essential to know.
Bounce Rate
Tracks the percentage of people who land on a webpage and leaves without any interaction (i.e. button click). According to Google:
Bounce rate is single-page sessions divided by all sessions or the percentage of all sessions on your site in which users viewed only a single page and triggered only a single request to the Analytics server.
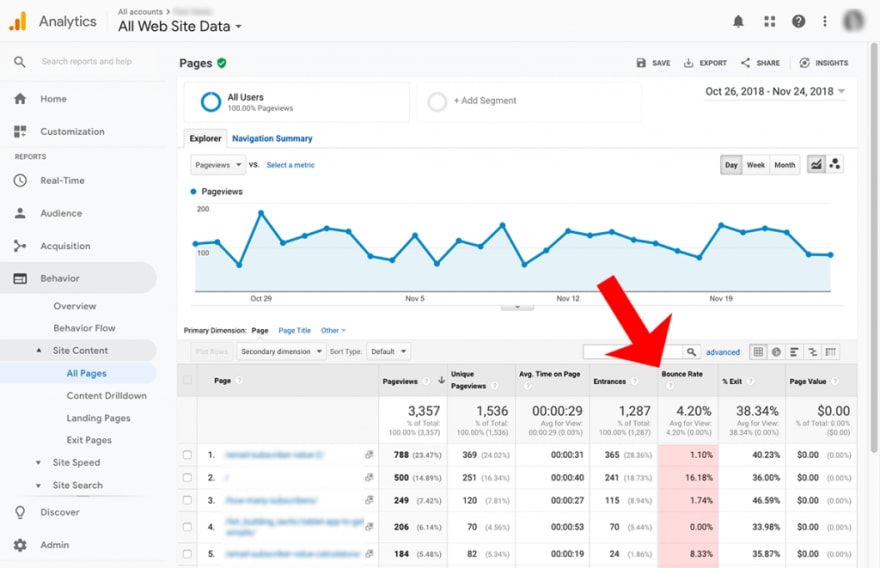
In a typical website, a bounce rate between 30% and 40% is considered good; below 20% is excellent. Anything above 70% is considered bad because it implies that the user does not engage with your website. However, for blogs, this data can be very differently interpreted. Most of the readers will only read the article and exit the page without clicking a button. So it makes sense why the bounce rate of a blog can be higher than a business website.
Keep in mind that the lower your bounce rate, the better; but for blogs, it depends. It is a useful data to see how many readers who visited your page clicked a like or leave a comment. But don't use Bounce Rate as your only measurement for your blog's performance because it does not tell the whole picture. The Bounce Rate of your overall website is displayed on your analytics 'Home' tab. You can view individual Bounce Rates of your pages by navigating to Behaviour > Site Content > All Pages.
Combining Bounce Rate with other statistics such as Average time on Page, Page Views, Pages per Session can give you a better understanding on your audience and page performance.
Session
A session refers to the period of time that a visitor is engaged on your website (i.e. page views, button clicks). It acts as a container that collects the visitor's interaction within the website for that period of time. By default, a session expires after 30 minutes of inactivity. It is viewed on your 'Home' tab or Audience > Overview (shows the same thing).

Note that a session is a time period of activity, which means one session can have multiple page views and one user can have multiple sessions. It is important you don't get confused by the statistic.
Active Users vs. Users
On your Analytics 'Home' tab, the first data you will see is 'Users', which tells you the number of visitors who visited your page within a session.
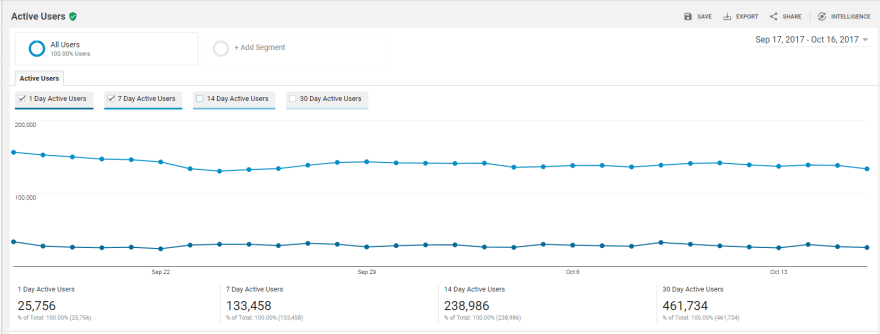
Active Users, on the other hand, is more helpful because it counts the number of unique visitors within a session. In Google Analytics, you can observe the trends of your Active Users in time-period windows such as 1-Day, 7-Day or even 28-Day. This statistic can be found under Audience > Active Users.
Channels
As you slowly try to grow your visitors, it becomes necessary to understand where your audience come from and try to leverage your channels to optimize traffic. You can find the channels - how your visitors get to your site - under Acquisition > All Traffic > Channels.

There are 5 main sources of channels Google Analytics identify for you:
- Direct: User types in your URL directly without a search engine or referral website.
- Social: Traffic arrived from social media platforms.
- Referral: From links outside search engines (i.e. a blog or news site)
- Organic Search: Natural traffic from search engines.
- Paid Search: Traffic from paid ads on search engines.
Content Drilldown
The Content Drilldown gives you a snapshot summary of your website's page paths performance in terms of page views and bounce rates. It can be accessed via Behaviour > Site Content > Content Drilldown.
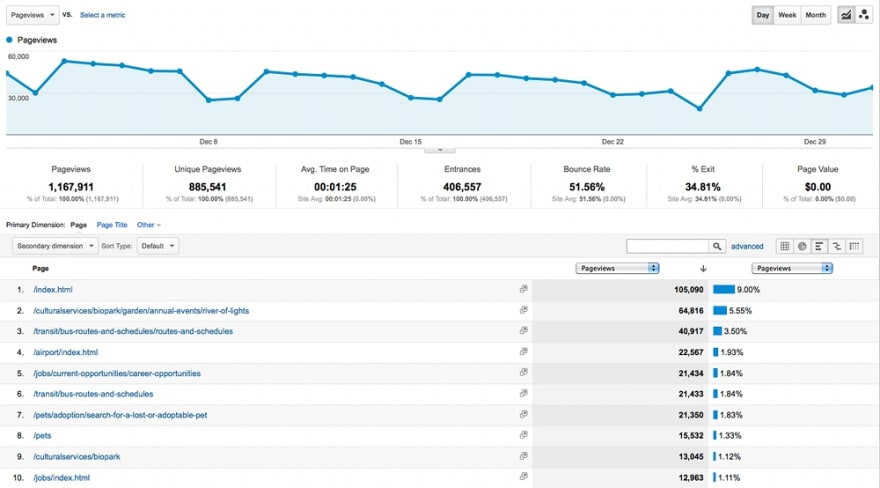
For blogs, each article would have their own page path. You can use Content Drilldown to see which articles yield the highest page views and lowest bounce rates. That can help you figure out the type of content your audience are interested in. For business sites, a page path can be like '/products' or '/products/hats' which can give you** insights on the most popular product** categories for your business. Overall, it is a very insightful statistics to use when trying to find out which section of your website is most likely to bring in new/returning visitors.
Search Queries
Understanding which search keywords that are relevant to your website can help you speed up the growth of your website. In Google Analytics, you can set this up by linking your Google Webmasters Tool (aka Google Search Console) to your Google Analytics account. Then, you can find your top search queries under Acquisition > Search Console > Queries.

When you managed to have it set up, you can see the following:
- Search Query: the keywords that trigger your website to be shown on the search results page
- Clicks: the number of clicks to your website that resulted from the query
- Impressions: the number of times your URL is seen by a user
- CTR (Click-Through Rate): Clicks/Impressions * 100
- Average Position: the average ranking of your URL on the search results page for this keyword
3. Filtering Data
So now that you have understood some important statistics to get started with Google Analytics, you can start collecting some data! But first, think about what kind of data you need to collect?
You probably visit your site several times a week so Google Analytics will count you as a user too. This can ultimately lead to less accurate data being collected. You can solve this issue by filtering your view to remove internal traffic and collect data from only visitors and not yourself. Let me show you how you can do that in Google Analytics.
Step 1: Create New View
Go to Admin > Create View. Name the view 'Master View' because this is the view you'll want to see most of the time.

Step 2: Add New Filter
Then make sure you have the Master View selected (see image below) and click 'Filters'.

Then click 'Add New Filter'. And fill in the following details as shown in the image below:
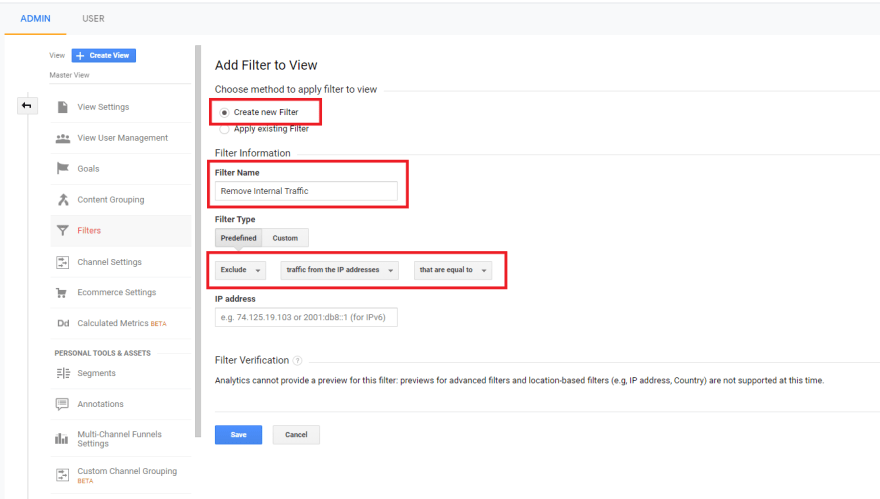
For IP address, simply Google: What is my IP address? and paste it to the IP Address field. Save the filter and you should see it under your View > Filters. This Master View will now only track users, excluding yourself.
And there you go!
I hope this guide has been helpful in getting you started with Google Analytics, in terms of:
- Integrating it to your website
- Understanding some basic statistics
- Filtering data to remove internal traffic
Learning some analytics for your blog or business website can help you grow your brand in the long run. It's always good to start early so you can experiment!
There is so much more you can do with Google Analytics like creating custom metrics, setting goals and creating custom events! If you are interested in learning more, please visit the Google Analytics Academy I mentioned earlier to learn some more on your own free time.
Numbers have an important story to tell. They rely on you to give them a clear and convincing voice.
-- Stephen Few
Thanks for reading this ridiculously long post. Have a fantastic day! Till next time, cheers!
P.S. If you managed to obtain a certificate, don't forget to share it with me on Twitter or the comments below so I can congratulate you! :)

Top comments (0)