
Hi all, tedsuo back again, dropping a knowledge bomb and a bunch of stale-yet-crunchy pop culture references. Last week we covered Node; this week we are going to dive into Python.
If you crack open OpenTelemetry, you’ll quickly discover that there’s a lot there. But, as a developer applying OpenTelemtry to your application, 99% of what’s in there doesn’t matter.
TL;DR
All you need to know is:
- Initialization: How to start and shutdown cleanly.
- Tracer methods: get_tracer, get_current_span, startSpan, and withSpan.
- Span methods: setAttribute, addEvent, recordException, setStatus, and end.
Seriously, that’s it. If you want to try it out, follow the guide below. A heavily commented version of the finished tutorial can be found at https://github.com/tedsuo/otel-python-basics, please use it as a reference when you get started with instrumenting your own application.
Python: Off to Docker
(If you already have a python setup you’re fine with, just skip this bit).
This time, let’s do our local development in docker. Managing Python installations can be a bit of a snake’s nest, especially on a mac, where the current default python3 installation has a bit of an issue with psutil, which we depend on.
First, make a directory for your application:
mkdir otel-py-demo && cd otel-py-demo
Install docker, then grab a python image and start a container that mounts your application directly. If you’re in your app directory, the following starts a python container with your current directory mounted at /app, and logs you into a bash shell within the container.
docker run -it -v $PWD:/app python:3.8 bash
Whenever you need to log into a new terminal, find the container ID, and then use it to exec into a bash shell.
% docker ps
CONTAINER ID   IMAGE         COMMAND    ETC...
bc1e3c27f4d0   python:3.7   "python3"   More columns
% docker exec -it bc1e3c27f4d0 bash
And that’s “all you need to know” about docker. 😁
Hello, World
Once again, it is time to say Hello to this cruel World.
First, exec into your docker container and install the required dependencies. For this basic app, we’re going to use flask for the server, and requests for the client.
cd /app
pip install flask
pip install requests
Create a file named server.py and make the world’s simplest app.
#!/usr/bin/env python3

from flask import Flask
from time import sleep

PORT = 8000
app = Flask(__name__)

@app.route("/hello")
def hello():
   sleep(30 / 1000)
   return "hello world\n"

if __name__ == "__main__":
   app.run(host="0.0.0.0", port=PORT)
Amazing. Add a client at client.py which makes five requests in a loop:
import requests

for i in range(5):
   r = requests.get("http://localhost:8000/hello")
   print(r.text)
In one docker terminal, start the server:
> export FLASK_ENV=development
> python server.py
 * Serving Flask app "server" (lazy loading)
 * Environment: development
 * Debug mode: on
 * Running on http://0.0.0.0:8000/ (Press CTRL+C to quit)
In another, run the client:
> python client.py
Hello World
Hello World
Hello World
Hello World
Hello World
It works!
Install OpenTelemetry
Ok so if you know python that was all very boring. Here’s the stuff you came for: installing opentelemetry.
First, you need to pick the analysis tool you want to target. I work on Lightstep, and we have a free Community account specifically for trying out OpenTelemetry like this. These instructions assume you have one of those. If you’d like to set up Jaeger instead, you can find installation instructions here.
To connect to Lightstep, install the Lightstep distro for OpenTelemetry, the OpenTelemetry launcher. Lightstep is OpenTelemetry native, all the launcher does is install the relevant packages and make the configuration simpler.
pip install --use-feature=2020-resolver opentelemetry-launcher
The launcher will install the core opentelemetry components, plus the currently available instrumentation. Just to unpack it a bit, there are three critical packages, beyond the launcher itself, which are worth understanding as they explain how OpenTelemetry is structured.
- opentelemetry-api: the API package contains the opentelemetry instrumentation API. This package only contains interfaces, no implementation. It is safe to bring into any package without concern that a large dependency chain may follow it.
- opentelemetry-sdk: the SDK package contains the standard implementation for opentelemetry. This implementation is a framework written in python, allowing for various exporters, samplers, and lifecycle hooks to be plugged in, so that a wide variety of analysis tools can be supported.
-
opentelemetry-instrumentation: this package contains two command line tools for automatically instrumenting your application:
opentelemetry-bootstrapandopentelemetry-instrument. We’re going to use both of them now.
Install Automatic Instrumentation
The first command to learn is opentelemetry-bootstrap. This will inspect the currently installed site-packages, and detect any packages we have instrumentation available for. By default, it prints out the packages to be copied into a requirements file, but it can also install them for you. For this example, let’s run it in installation mode.
opentelemetry-bootstrap --action=install
And that’s it for installation!
Run with OpenTelemetry
The easiest way to run OpenTelemetry is via the opentelemetry-instrument command, using env vars for configuration. You can find a list of available configurations here, but there are only two which are required:
-
LS_SERVICE_NAME- The name for this type of service. We’ll usehello-severandhello-client, respectively. -
LS_ACCESS_TOKEN- You can find this one by first logging into your Lightstep account (or create one), then going to the settings page. Use the clipboard button to copy the access token.
To run opentelemetry with Lightstep, first log into your account and find your access token on the Settings page. Use the clipboard button to copy the access token.
export FLASK_ENV=development
export LS_SERVICE_NAME=hello-server
export LS_ACCESS_TOKEN=<ACCESS TOKEN>
opentelemetry-instrument python server.py
Do the same for the client.
export LS_SERVICE_NAME=hello-client
export LS_ACCESS_TOKEN=<ACCESS TOKEN>
opentelemetry-instrument python client.py
Check for data by clicking on the explorer:
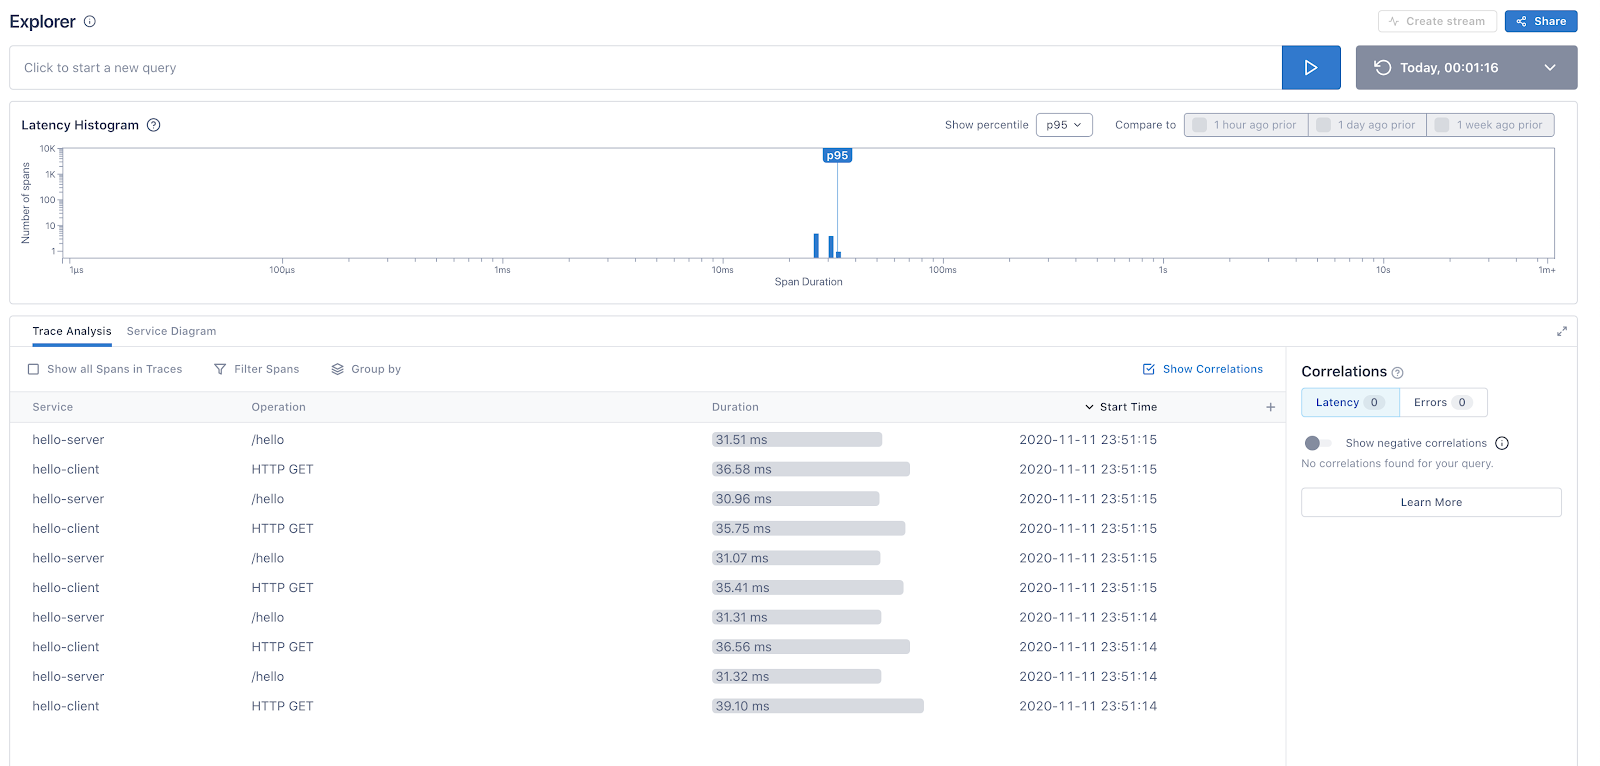
Huzzah! We see some spans. Click into one and check out the trace.
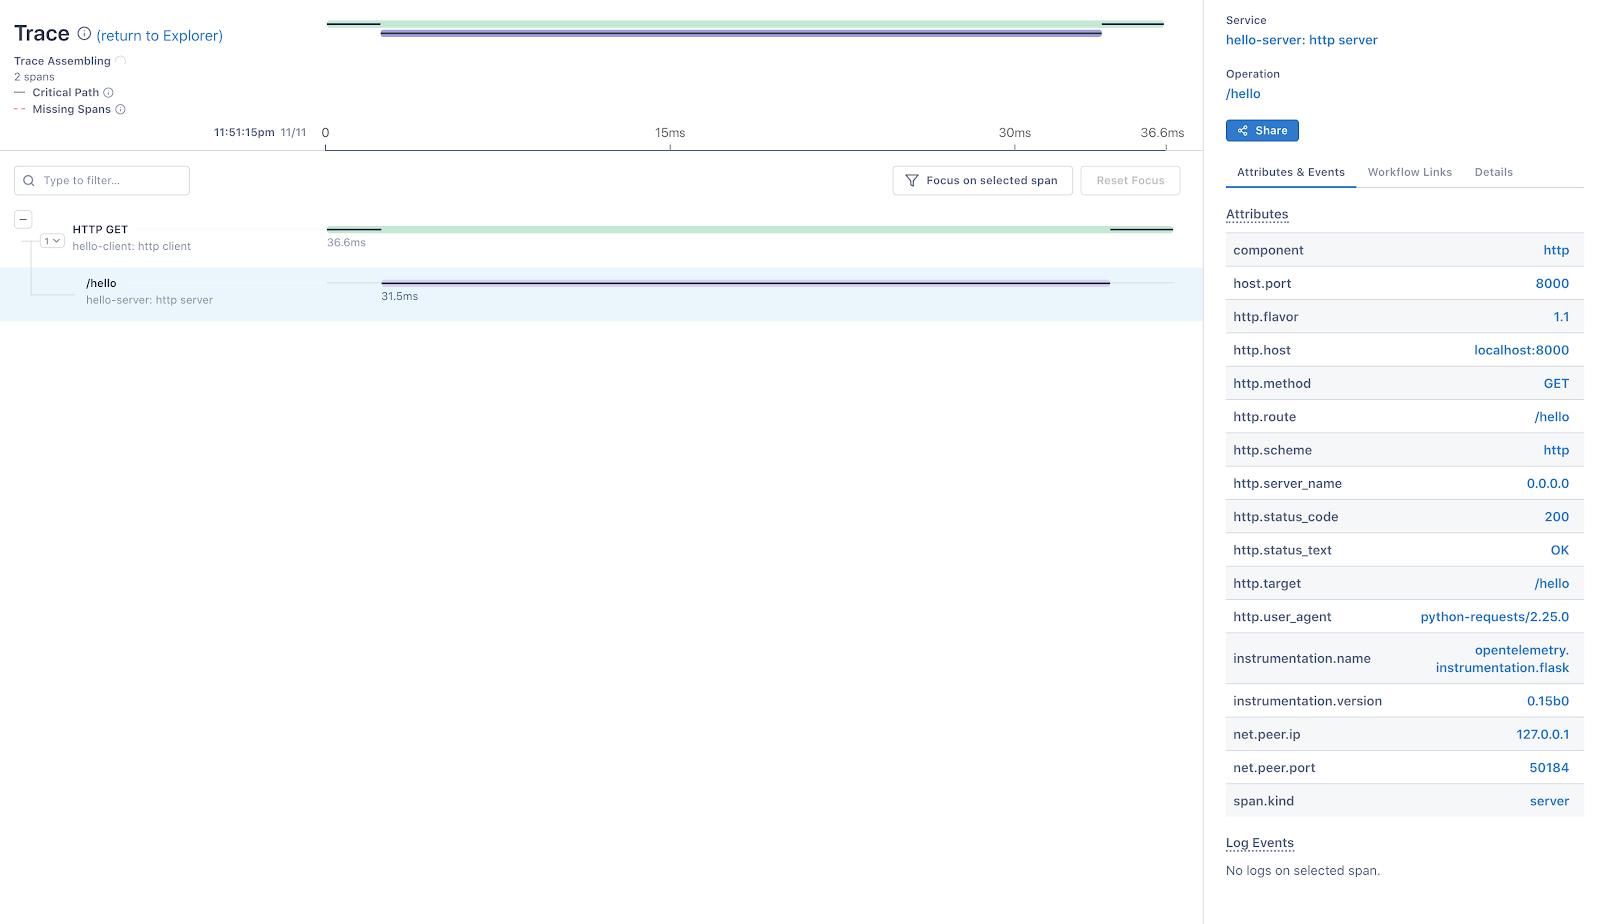
Let’s pause for a second and review the data we are looking at. There are two spans, one from the requests package on the client, and one from the flask package on the server. Clicking on a span, you can see that it is already rich with data.
-
http.*andnet.*– these conventions describe everything about the request. -
instrumentation.name– this describes the instrumentation package which generated the span. -
span.kind- either client, server, or internal.
The representation of common concepts like HTTP are standardized across languages. so that analysis tools can automatically interpret the data they are looking at. We refer to these standardized attributes as Semantic Conventions. The complete list can be found here.
No code required
The biggest, most important note is that we added OpenTelemetry to our service, but didn’t write any code. Everything could be done from the command line. This means that OpenTelemetry can potentially be added to a service by an operator, with a simple modification to deployment.
I highly recommend this approach as a first pass, before adding any additional detail. OpenTelemetry needs to be installed in every service in order for distributed tracing to work. It is more important to get every service instrumented at a high level than it is to dig in and deeply instrument the application code in a particular service. Library level instrumentation (flask, requests, redis, etc) will give you enough information to set up alerting root causing issues.
If this is the first time you’ve added distributed tracing to your system, don’t be surprised if a number of latency-related issues immediately become visible! After you’ve done a wide-scale rollout, you can dig in selectively and add detail where needed. Converting your existing logs to span events is another great way to add detail without having to write a lot of code.
Using the OpenTelemery Python API
Okay, automation is great, but eventually, you are going to want to add detail. Spans are already decorated with standardized attributes, but once you’re settled in, you will want to start adding more detail.
The most important details to add are application-level attributes critical to segmenting your data. For example, a projectID allows you to differentiate between errors that are affecting everyone connecting to a service, vs errors that are localized to a handful of accounts. Those would be two very different scenarios, and you would probably start looking in different places based on that feedback.
Also, logs. They are a thing. OpenTelemetry has a structured logging facility, we just call it events.
Adding data to the current span
To add additional data to your trace, you need access to the currently active span. Since context propagation is already set up, thanks to the automatic instrumentation, there is already a span available to you.
Attributes are simply key value pairs. Events consist of a message and a dictionary of attributes.
from opentelemetry import trace

@app.route("/hello")
def hello():
   # get the current span, created by flask
   span = trace.get_current_span()
   # add more attributes to the server span
   span.set_attribute("http.route", "some_route")
   # add events (AKA structured logging)
   span.add_event("event message",
                  {"event_attributes": 1})

   sleep(20 / 1000)
   return "hello"
It’s best to add data to existing spans, rather than create child spans. This keeps all of the attributes grouped together, which makes for better indexing.
Creating a child span
Of course, you are going to want to create child spans on some occasions. A span represents a distinct operation - not an individual function, but an entire operation, such as a database query. Generally, this means you shouldn't be creating spans in your application code, they should be managed as part of the framework or library you are using.
But, that said, here is how you do it. First, create a tracer. A tracer is just a namespace - it lets you know which package created the span, via the instrumentation.name attribute (you can also add a version as a second parameter).
Span management has two parts - the span lifetime and the span context. The lifetime is managed by starting the span with a tracer and adding it to a trace by assigning it a parent.
# Start the span with a name and a parent span
child = tracer.start_span("my_operation", parent=parent)

try:
   # pass the span around as a parameter
   do_work(span=child)
finally:
   # End the span, which measures the span duration and
   # triggers the span data to be exported.
   # WARNING: failing to end a span will create a leak.
   child.end()
Using spans directly like this is cumbersome. Instead, we want to create a new context where the span is active so that it can be accessed by get_current_span instead of passing it around. In almost all cases, the easiest way to manage a span is by calling start_as_current_span.
from opentelemetry import trace

# create a tracer and name it after your package
tracer = trace.get_tracer(__name__)

@app.route("/hello")
def hello():
   # add latency to the parent span
   sleep(20 / 1000)

   # always create a new context when starting a span
   with tracer.start_as_current_span("server_span") as span:
     # add an event to the child span
     span.add_event("event message",
                    {"event_attributes": 1})
     # get_current_span will now return the same span
     trace.propagation.get_current_span().add_attribute()
     # add latency to the child span
     sleep(30 / 1000)
     return "hello"
If you ever need to create a span in your application code, I strongly recommend using the above pattern.
Recording errors
Ok, one final bit. We’ve covered spans, attributes, and events. But what about exceptions? Exceptions are reported as events, but they should be properly formatted. As a convenience, OpenTelemetry provides a record_exception method for capturing them correctly.
from opentelemetry.trace.status import StatusCode

@app.route("/hello")
def hello():
   span = trace.propagation.get_current_span()
   try:
       1 / 0
   except ZeroDivisionError as error:
       # record an exception
       span.record_exception(error)
       # fail the operation
       span.set_status(StatusCode.ERROR)
       print("caught zero division error")
Uncaught exceptions are automatically recorded as errors.
Conclusion
And that is that. All you need to know to get started with tracing in Python.
Hopefully, it’s clear that If you stick with the above patterns, you can get a great deal of visibility with very little work. Of course, there are many more details and options; you can check out the API documentation for more information. I also have a more involved getting started guide; it works as a handy reference for all of the procedures described above.
OpenTelemetry is still in beta due to API changes, but it is also already in production across many organizations. If you stick to a Distro and automated instrumentation, you can use OpenTelemetry today without much fear of a breaking change affecting you.
Also: consider joining our community! There are plenty of libraries left to instrument. You can find us on GitHub, or say hi on gitter.

Top comments (0)