RxTutor (inspired by RxMarbles) is an online interactive sandbox for visualizing RxJS observables. RxTutor is interactive like RxMarbles in that you can drag the nodes of the input observables to see how the output observable changes. RxTutor has the added functionality of being able to change the input observable parameters as well as change the code for creating the output observable.
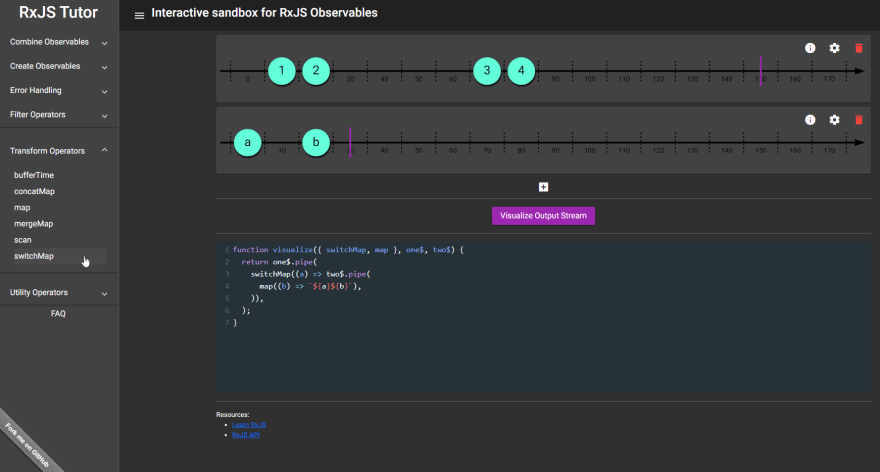
RxTutor has a range of examples added as starting points for change and playing around.
Why was RxTutor Created?
When I started out learning RxJS, RxMarbles was invaluable in helping me understand how each of the RxJS operators behaved. Further down the line, as I started implementing RxJS in code, I quickly got to a point where I struggled to understand / internally visualize how a combination of operators would behave or how the RxMarbles example tied up to a more concrete example with say a different number of emitted values or different point of completion.
And so the idea of RxTutor was born. I wanted to be able to visualize RxJS observables while being able to change the input observables (their emitted values, their number of emitted values, how they complete or error, etc.) as well as being able to combine multiple RxJS operators to generate the output observable.
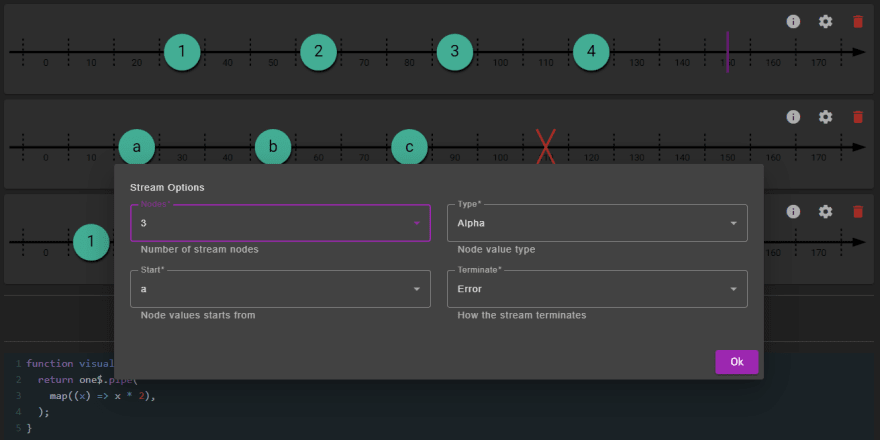
Input Observables
RxTutor allows adding up to three observables as input to the visualization code. Each input observable has nodes (including an optional complete or error node) that can be dragged to different frames to see how the output observable changes.
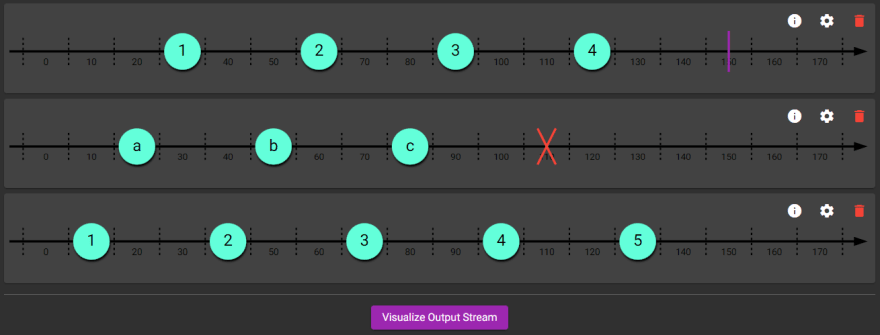
The next nodes are visualized as circles (with the emitted value shown in the centre), while the complete node is visualized as a pipe (|), and the error node is visualized as a cross (X).
Each input observable can be configured via its gear icon, which brings up a stream options modal.
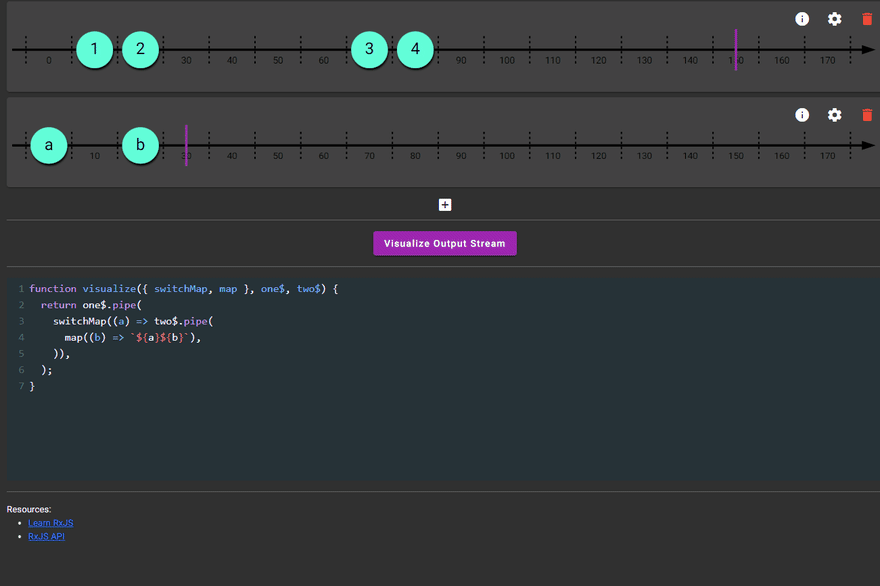
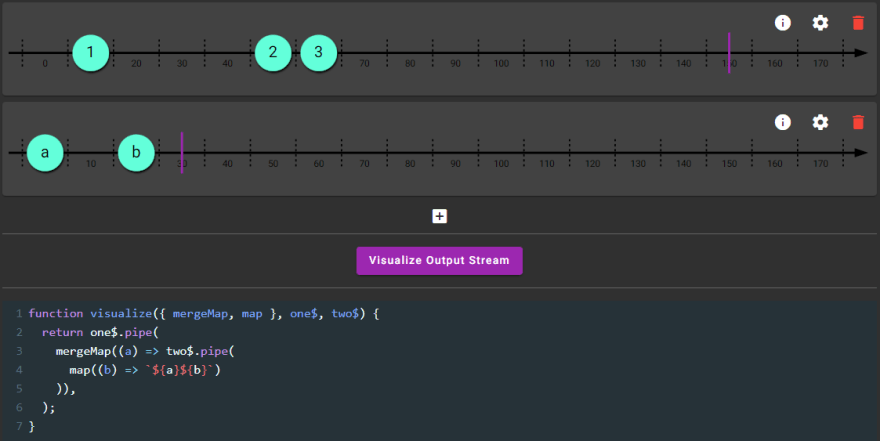
Visualization Code
The visualize method has four arguments, the first being RxJS, the second, third and fourth being the input observables.
function visualize({ switchMap, map, tap }, one$, two$, three$) {
  return one$.pipe(
    switchMap((a) => two$.pipe(
      map((b) => `${a}${b}`),
      tap((x) => console.log({ x })),
    )),
  );
}
Destructuring assignment syntax is used, in the RxTutor examples, for unpacking the required RxJS operators used with the input observables to return the output observable.
Output Observable
The output observable is created from the input observables and RxJS operators used in the visualize method.
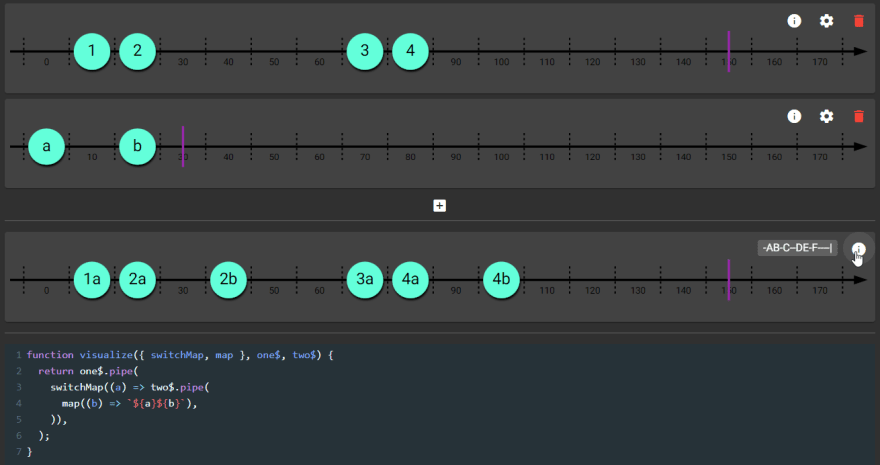
If the output values are small (less than 3 characters) then they are displayed directly, else a marble symbol is shown. The marble diagram (along with the values) for each observable can be copied to the clipboard via the information icon.
'-AB-C--DE-F----|',
{
  "A": "1a",
  "B": "2a",
  "C": "2b",
  "D": "3a",
  "E": "4a",
  "F": "4b"
}
Contribute
If you find a bug, have a feature suggestion, or would like to contribute to RxTutor, then feel free to visit the GitHub repository.
Rxtutor
![]()
An interactive sandbox for RxJS Observables


Top comments (0)