In today's fast-paced software development landscape, performance testing is essential to ensure the reliability and scalability of applications. Docker has emerged as a valuable tool for simplifying the setup and management of performance testing environments. In this article, we'll explore how to leverage Docker to create a powerful performance-testing stack by integrating K6, InfluxDB, and Grafana.
Unpacking K6 👩💻
- An open-source load testing tool that makes performance testing easy and productive for engineering teams. It's free, developer-centric, and extensible.
- Ability to write performance tests as code.
- Ability to run in hybrid mode to check for both Frontend & Back end performance test
Key features of K6 🤔
- Load testing
- Browser testing. Through the k6 browser, you can run browser-based performance testing and catch issues related to browsers only which can be skipped entirely from the protocol level.
- Chaos and resilience testing. You can use k6 to simulate traffic as part of your chaos experiments, trigger them from your k6 tests, or inject different types of faults in Kubernetes with xk6-disruptor.
- Performance and synthetic monitoring
A Hands-On Approach 🚀
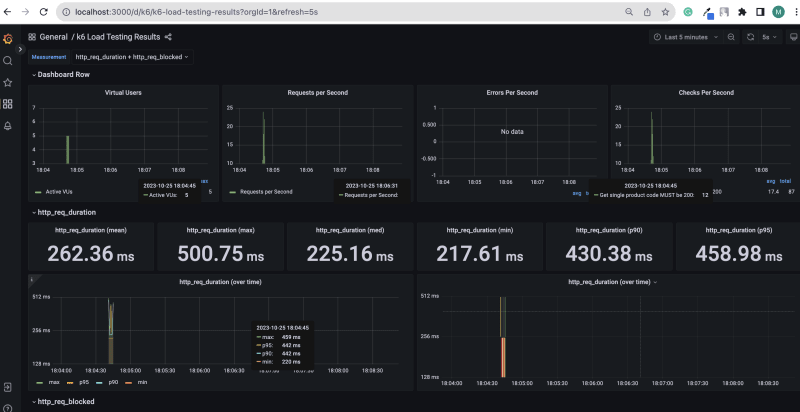
- We set up the infrastructure to run the performance test with Grafana K6. Then, we send the test results to InfluxDB and visualize them to the Grafana Dashboard as a Time Series Analysis report.
Prerequisites:
- Make sure that Docker Desktop is installed on your machine.
Steps
- Clone the Repository:
https://github.com/lengochoangminh/hands-on/tree/main/k6
- Navigate to the folder K6
- Then launch the infrastructure:
docker-compose up -d influxdb grafana
- and execute the test script:
docker-compose run k6 run /src/test_scripts/dummy-json/GetSingleProduct.js --insecure-skip-tls-verify
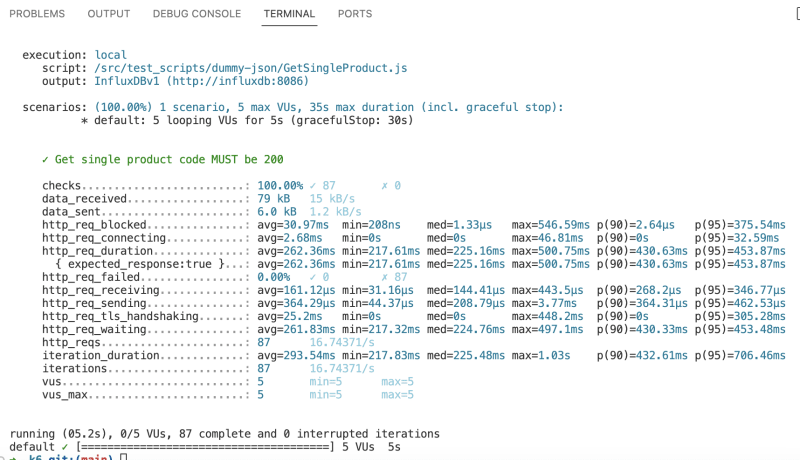
- Finally, let's open your web browser and navigate to Grafana Dashboard to monitor live test results in Grafana Dashboard at http://localhost:3000/d/k6/k6-load-testing-results


Top comments (0)