We created a Datadog dashboard to monitor, across our organization, basic metrics about the health of our apps : logs in errors by service, Kubernetes containers restarts, APM errors by service, etc.
A few weeks ago, I wanted to add a "Team" filter on it : the goal was to help our different teams using it during their "morning routine" (a daily check of their applications metrics).
It appeared more challenging than I thought but with the help of Datadog Support we managed to figure it out. I am sharing this knowledge here in case that can help you achieve the same goal.
Introduction
Basically the most important link is this one, listing all available metrics in your Datadog account :
If in the "Tags" section of your metric (the one you want to use in your dashboard) you do not see the one you want to filter on (in our case "team"), then it means it has not been propagated correctly.
We discovered with Datadog Support that the tagging is different given the nature of the metric you want to use in your dashboard.
Here are the 3 usecases we identified, but first let's do some preparation if you plan to filter your metrics on teams.
Preparation
- make sure all your different teams are described here : https://app.datadoghq.com/teams
- make sure all of your services do have the right team assigned : https://app.datadoghq.com/services
- make sure all your pods have a defined label "team" in their Deployment or DaemonSet manifest : ```
spec:
template:
metadata:
labels:
team: your-team-name
## Logs metric

Make sure your Datadog agent does have this environment variable in its configuration : it will map the label "team" of your pods with the tag "team" of metrics collected from it.
- name: DD_KUBERNETES_POD_LABELS_AS_TAGS value: '{"team":"team"}'
> Important : if you do use a **custom** logs metric in your dashboard (that means this one is defined [here](https://app.datadoghq.com/logs/pipelines/generate-metrics), then edit it and make sure to add the "team" tag in the "Group By" section like this :
> 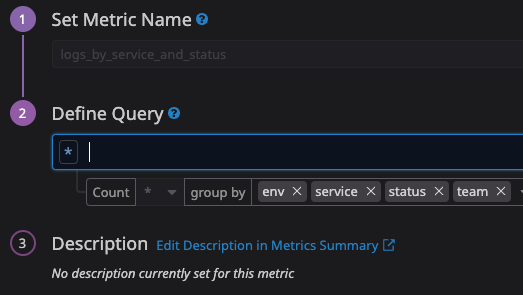
> Clic on "Update Metric"
Wait and see if it populates correctly in :
- https://app.datadoghq.com/logs (clic on one recent log to see its details)
- https://app.datadoghq.com/metric/summary
## Kubernetes metric
If you want to filter your `kubernetes_state.container.*` metrics for example, make sure to have this option activated for your Datadog **Cluster** agent configuration.
If you set up it through [Helm](https://github.com/DataDog/helm-charts/blob/bc09ff3950999aeea1ee142e055b6be452902feb/charts/datadog/values.yaml#L194) :
datadog:
kubeStateMetricsCore:
labelsAsTags:
pod:
team: team
If you set up it manually through a YAML manifest, make sure to update this [ConfigMap](https://github.com/DataDog/datadog-agent/blob/main/Dockerfiles/manifests/kubernetes_state_core/cluster-agent-confd-configmap.yaml#L38) :
labels_as_tags:
pod:
team: team
Wait and see if it populates correctly in :
- https://app.datadoghq.com/metric/summary

## APM metric

If you want to filter on `trace.servlet.request.errors.by_http_status` for example, you will need to add this environment variable to your Datadog agent configuration :
- name: DD_APM_FEATURES value: 'enable_cid_stats'
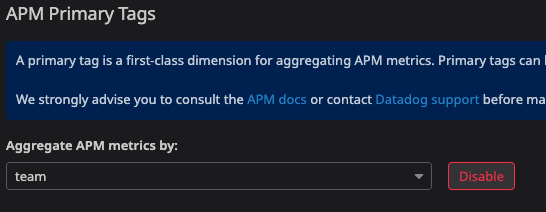
Then go [here](https://app.datadoghq.com/apm/settings) and "Aggregate APM metrics" by "team" like this :
Wait and see if it populates correctly in :
- https://app.datadoghq.com/metric/summary
## Plugging team filter to your dashboard
Finally it's time to use this new tag you populated!
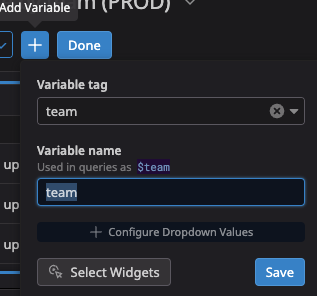
On the upper right of your dashboard, clic on the **+** ("Add Variable") and specify it like this :
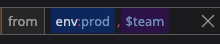
Then edit all the sections to add it to the scope of the metric displayed in each one of them, and Save, like this :
Hope it helped, have a great day and happy monitoring!
## Sources
- https://docs.datadoghq.com/containers/kubernetes/tag/?tab=manualdaemonset#pod-labels-as-tags
- https://docs.datadoghq.com/tracing/guide/setting_primary_tags_to_scope/?tab=kuberneteswithouthelm#container-based-second-primary-tags

Top comments (0)