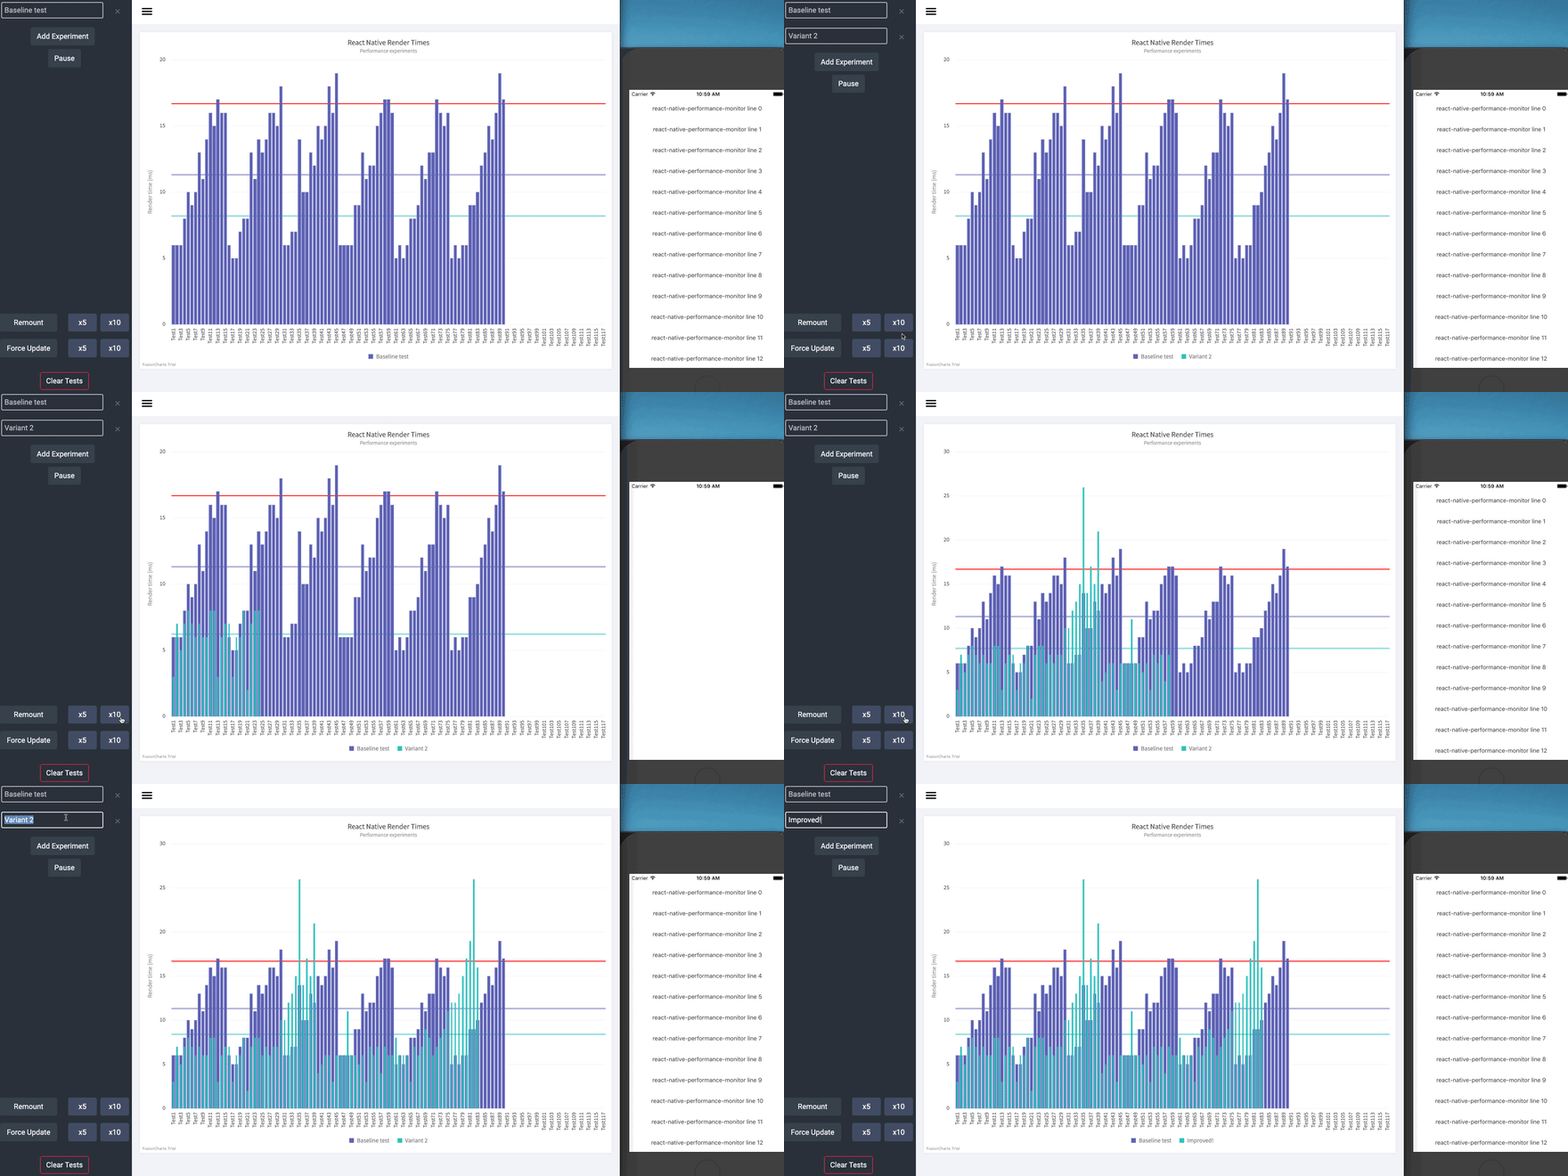
This post covers an introduction to react-native-performance monitor, a realtime performance monitor for React Native I've just made (which would also work for React). The tool is completely open-source, published on npm and can be checked out here.
Motivation
Even for the most experienced React Native developer, maintaining and improving performance in a large React Native app can be far from trivial. Also, the act of implementing performance improvements is an art in itself. Based on experience here's my checklist for a starting such an approach:
1 - Don't jump straight in, get a benchmark!
This is probably the most important point, and above all, is the main motivator for this tool.
Although it's very tempting to jump in and chop away at ugly lines of code, without a real measurement of a before and after a lot of the times you're pretty much none the wiser how big of an impact you made (the odd change here and there may even introduce a performance deficit)
2 - Make sure there's a good cost-benefit
Simply put, if you've reduced the maintainability and readability of the code for a couple of milliseconds improvement, it's probably not worth it. To reiterate the first point, this is made a lot easier if you have numbers to back this up, don't introduce bias and the phrase "it feels faster".
3 - Record your findings
You've reached a mind-melting conclusion that will improve your React Native knowledge forever, great! Record your finding and document them / share it with your team.
4 - Periodically retest
Without a good way to test performance again at a later date, you could find that your hard work is ruined by regression.
Profiler in React Native
As of React Native 0.61.0, the React Profiler is now officially stable. Profiler component exposes the following callback as a prop:
function onRenderCallback(
  id, // the "id" prop of the Profiler tree that has just committed
  phase, // either "mount" (if the tree just mounted) or "update" (if it re-rendered)
  actualDuration, // time spent rendering the committed update
  baseDuration, // estimated time to render the entire subtree without memoization
  startTime, // when React began rendering this update
  commitTime, // when React committed this update
  interactions // the Set of interactions belonging to this update
)
This release allows you to also profile interactions much like you'd do in chrome on the web.
Although useful, I have a few problems with using this to test performance and iterate.
- The feedback loop is slow. This requires a process of recording, writing down the numbers, making a change and then recording again.
- The information can kind of become a bit overwhelming and confusing to work with, this is especially true with larger applications with many nested components.
- The output of the tests depends on how quickly you hit record and performed the interactions.
I get the best use out of this by using it to figure out a starting place of what to work on. But in my mind, I feel like making performance improvements needs a different tool, one that provides immediate, a/b comparison based feedback.
Introducing react-native-performance-monitor
Considering the above I decided to get to work in making this tool. I've been using it for a few weeks and believe the best approach is to:
1 - Identify an area of the application you feel needs improving (maybe via the React Profiler).
2 - Record your baseline by either triggering a component mount or force update, I added x5 and x10 buttons to get a better average baseline. Whether you choose to test remounting or force updates depends on the nature of what you are trying to test, if your component receives frequent updates somewhere in the tree you may see a lot of benefits just concentrating solely on updates.
3 - Whilst you are developing pause the recorder, then when you want to out your changes add a variant and click resume.
4 - Repeat 3 as many times as you need to to reach an improvement, to reduce the noise you can always clear tests that you wish to discard.
I thought I knew React Native inside and out having worked on it since 2015, but seeing metrics for every little change opens up a rabbit hole of things you thought you knew. It's strangely addicting to play around with.
The amount of subtle changes with components and their impact has surprised me, for example:
This difference was entirely down to the following code. I, of course, could understand why this would be the case however I'd not predicted the effect this change would have.
Before:
<Text style={[this.props.style]}>
    {this.props.children}
</Text>
After:
<Text style={this.props.style}>
    {this.props.children}
</Text>
How it works
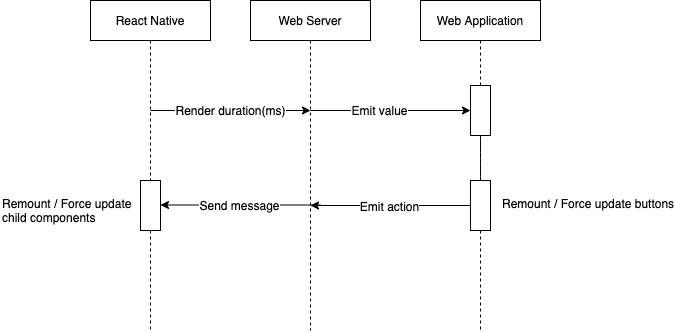
The overall implementation is quite straight forward and simply involved passing the onRenderCallback values via a WebSocket server to finally render them in a fancy graph.
There are 3 main components:
- A React Native component that sends profile data to a server via REST and listens to messages (remount and force update) to trigger renders.
- A Web socket server responsible for passing messages between the graph and the react-native component
- A Web application that receives WebSocket values and renders them to a graph
The following diagram is a brief explanation of the data flow:
Next steps
Hopefully this has encouraged you to also jump into the rabbit hole of optimising your app. This project is still in its infancy but I'm open for feedback and how it could further help everyone out. Check it out and let me know!


Top comments (3)
I find I often need to be repeat this sentiment, it's so true.
This is a really cool project, definitely going to try it out on one my projects.
Also, just a heads up, your link to your Github repo is broken, I think you pasted the url twice.
Haha I’m glad that resonates I see it quite often in projects! Thanks for the positive comments though, I’m genuinely so curious to see how people find using it.
Cheers for the typo spot, all fixed 👍
Great Project. I'm facing some issue. I have installed the package. Now, how to start the server and see the logs at 8125 port?