
One of the folks over at NDepend reached out to me to provide a license for their product; let’s do some exploring!
I’ve never actually used NDepend, and have only otherwise scratched the surface using other code analysis tools. Perhaps this will be a mis-categorization, but the few I’ve worked with previously include:
- FxCop
- StyleCop
- VS Enterprise code analysis (I forget if this is the actual name, I no longer have an enterprise license)
- SonarQube
The idea of tools like NDepend seems pretty straight forward, look through your source code, and identify potential pain points that could use another look. Sounds pretty simple in theory, but I’d imagine the details of such analysis goes way over my head.
Getting started in Visual Studio
Visual Studio is no longer my IDE of choice when working in .net core, but I dusted it off to play around with NDepend. It was quite simple to get installed as a plugin for visual studio, and here’s a helpful video if it’s not otherwise obvious on how to get started: https://www.ndepend.com/docs/getting-started-with-ndepend
I didn’t really know what to expect, and I don’t have any real significant (personal) code bases that I can hook this up to, so for now I’ll run it against my Design Patterns repository to get a baseline.
To kick off the analysis I clicked the circle icon in the bottom right of my visual studio instance, and was quickly presented with a dashboard that looked like this:
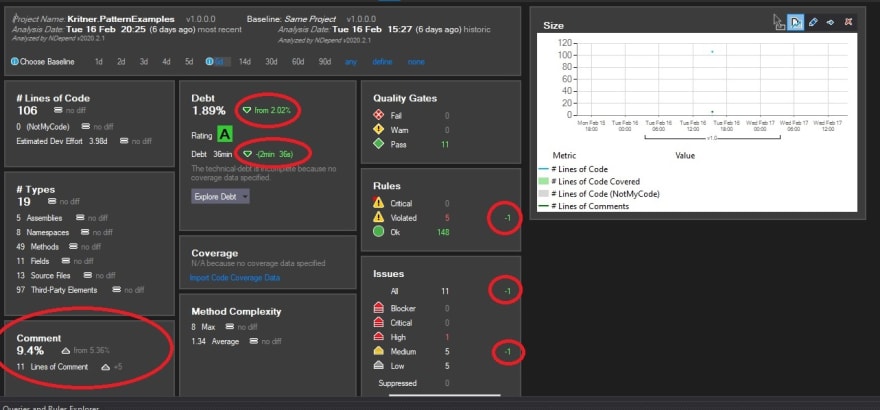
Note that this wasn’t actually my first run, I think it was my second or third after having changed a few lines of code in between runs to get a delta in the analysis. Looking at the dashboard it became apparent the analyzer must keep “state” as to what the issues are over time; which is a great sounding feature as it will allow you to track your code “smells” as your code continues to be developed!
The Dashboard
Upon first gazing at the dashboard (pictured above), I was honestly a bit overwhelmed. It was a lot of information, and I didn’t see an immediately obvious “starting point” of what I should be concerned with.
Twice weekly I meet with a few friends over a video/screen share session and we work through plural sight courses together, this week I actually had them on to do a “first impressions” of the NDepend tool; unfortunately my OBS setup was hosed up, and I lost most of the audio. I say this as it is not only my own “first impression” but others as well - namely several who have (slightly) used static analysis tools previously, and others who have not.
Sections
Here I’ll go over what I considered to be the “sections” that were present when going through the NDepend tool.
Dashboard

Sorry for the awful quality of the above image, it was taken from the recording that I couldn’t end up using due to lack of audio.
This seemed to be more or less the “meat and potatoes” of it all. We can see numerous metrics, some of which are pretty self explanatory, but several of which perhaps not so much for someone who is coming from a code base that has no testing; which granted is itself kind of a problem.
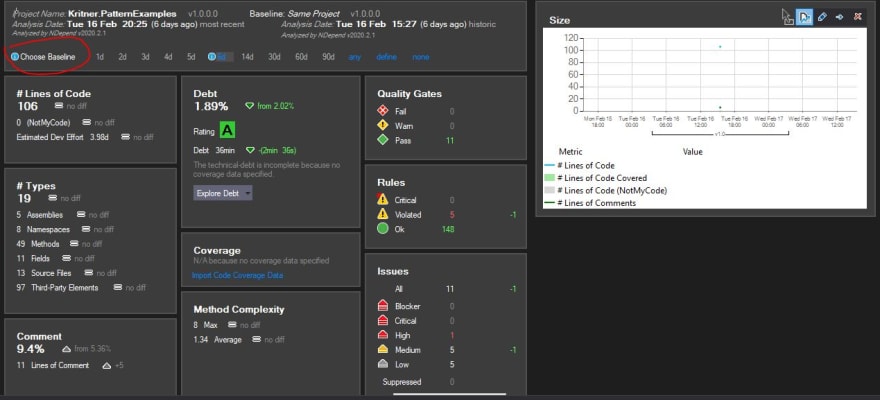
I did make a few adjustments to the code from the previous time I ran analysis, I am a big fan of tracking the code quality over time - so this is a huge benefit in my book. It was not immediately obvious to me how this information is tracked over time in a “multi developer project” situation. I am under the assumption that some of the files that were added to the project itself would need to be added to source control in order to track the information over time, but I’m not really a big fan of that (assuming my assumption is even correct). NDepend can be installed in some build systems, which I would guess would keep the analysis separate from the source, but tied to that repository in some manner. I believe I saw integrations for at TFS and TeamCity, I wonder if it could also be integrated with something like TravisCI or GitHub actions.
The sections:
- Lines of code - pretty obvious what this metric is, it shows the total number of lines of code in your analyzed solution, including a delta from the last time of analysis (or when comparing to a specific baseline).
- Debt - based on what I (think I) know about what technical debt, this metric would go up or down based on a potential variety of factors, namely method complexity and code coverage. This was one that we all had questions around.
- Quality Gates, Rules, Issues - None of us were sure what separates these issues from one another, but they seemed to be driven in some manner by the “Queries and Rules” that are enabled within a separate section, but that was another point of confusion coming to this for the “first time”. The gist of these sections seemed to be based around a configurable set of rules that you can (or not) tailor to your project. On the first run through it seemed like we were getting some false positives around use of System.Random being used in a “non security setting”. Seems that rules can be enabled or disabled on a rule level, or by utilizing attributes to ignore specific NDepend rules for a particular member within your code.
- Types - a breakdown of the various assemblies, namespaces, files, etc. that are a part of your codebase. It would be interesting to see how this changes over time within a code base.
- Coverage - I did not have any coverage in this particular project, and it was definitely asked about by the folks I was doing the walk through with. The way I assume it works it “Code Coverage” as a function of unit testing and exhausting code branches. A very useful metric to have, as long as you have meaningful tests and asserts.
- Method complexity - I’d imagine this is a similar metric to the Cyclomatic Complexity that is a part of the enterprise Visual Studio analysis tool. The more complex your methods are, the harder your code is to grok and/or maintain. This metric likely plays a large part in the “Debt” metric mentioned above.
Overall I found the dashboard pretty useful, if not a bit overwhelming. One thing I think the dashboard could use that would benefit the users of NDepend greatly, especially when they’re just starting out, is a little “i” popup per metric:
The popup could at a minimum describe the metric, but probably better, still link to the NDepend documentation on what exactly the metric means, and what goes into its calculation.
Queries and Rules Explorer

I was not really sure where to start here. When poking around with checking and unchecking things within this window, it seemed to impact what is “in scope” of the analysis. It seems like you can probably also define your own rules to look for in your code base, but we did not get into that in our first excursion into NDepend.
Queries and Rules Edit
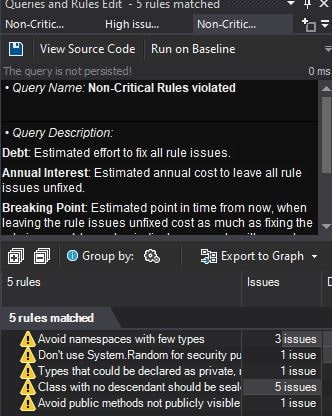
When clicking on an action item within the dashboard be it “good or bad”, this pane was updated. In the case of failed rule checks, you’d be given a means of fixing it, with navigation to the code block that failed the check. This section was quite useful for helping get more “green lights” on the dashboard, though it was quite cramped in the tab it showed up in, though I understand why it showed up there, so you could view the dashboard and/or problem code while keeping the failed rules list visible as well.
Review
Overall I find the information provided through NDepend to be quite useful, having a tool like NDepend running as a part of your build process, even automatically rejecting PRs if certain quality gates aren’t met sounds fantastic.
I did have a few concerns about “what exactly I’m looking at” which could be remedied via “?” or “i” links on the (granted already quite busy) interface; but I think overall would be a welcome change, especially for first time users (perhaps a feature toggle?).
How does this static analysis compare with other, now free options like Roslyn analyzers, or other tools like sonar, or perhaps even ReSharper? I would imagine there’s some overlap, but that’s not necessarily a bad thing if the multitude of tools bring something unique to the table. The analysis as compared to other baselines I found very nice, though I’m curious how it works in a “multi developer” setting, and with source control and build systems.
I look forward to actually implementing some tests in my analyzed project, and/or putting the tool up against something “more real” than my Patterns repository. Overall it seems like NDepend is a very powerful tool!

Latest comments (0)