
The 2019 Thoughtworks Radar advised organisations to adopt the four key metrics that have been published in the really well received Accelerate book. The reason behind that decision is that those metrics have been proved a reliable source of information to categorise teams in three categories based on their performance.
For those who don’t know about those metrics, let me share a short summary of each:
Deployment Frequency
It’s the number of deployments in a period of time. It’s expected that high-performing teams deploy several times a day. This is highly correlated with the next metric.
Lead Time For Changes
It’s the time in between a commit has been made, and this code gets into production. The expectations for a high-performance team is to deploy changes in between one day and one week.
Mean Time To Restore (or MTTR)
Is the mean time that is needed to go back to service when there has been a failure in production. For example, the time that we need to recover from a broken database or from a commit that breaks a feature. It’s expected that high-performers recover their services in less than a day.
Change Failure Rate
Is the ratio between failed changes and success changes in a service. For example, if we deploy four times in a week, and three of our deployments fail for some reason (there is a bug in the code, the pipeline is flaky), our CFR will be 75%. It’s expected that high-performers have a change failure rate lower than 15% percent.
Given that summary, I would like to share some findings that I hope are interesting for you all.
First of all, let me share with you the following diagram:

It’s (somehow) a Wardley Map that correlates the commodity of a practice or tool with their value. The value of each practice and tool are scoped only to DevOps practices and are focused mainly on the capacity to improve or reflect over team practices. That’s why for example, self organising teams have more probability to improve a single team than just implementing a CD pipeline. Of course, this map is not totally objective and it’s just based on my experience and feedback I gathered from some clients and colleagues.
The diagram below shows how there are three possible types of adopters, depending on their practices and tools. I think it’s not surprising that more relatable practices are close to each other in the diagram, and that practices that are in the top-left corner are key for high-performers. However, I would like to share some insights that I think are interesting:
It’s unlikely that a low-performing team would be interested in adopting the four key metrics framework. Probably they are not even aware of the metrics.
Gathering the Four Key Metrics have strong technical considerations and costs that low-performers can not take in the short-term. (more reasoning later)
Less performing teams will have less reliable metrics, which may limit the usefulness of the framework. Low-performers will need to gather and calculate those metrics manually, which increases the ratio of error.
Four Key Metrics are not per team, are per team and deliverable. So at the end, Four Key Metrics are useful for teams, but they do not measure overall team performance, but their performance given an artifact or business unit. (more on this later)
Gathering the Four Key Metrics
Is quite difficult and requires a set of practices that are not going to be adopted by low-performers in the short term. The ThoughtWorks Radar states that those metrics can be gathered at a pipeline level and that GoCD already provides a way to calculate them. However, the metrics that GoCD provides are Continuous Delivery metrics, which are a bit different. We need to be cautious about getting Four Key Metrics only from the pipeline, for several reasons:
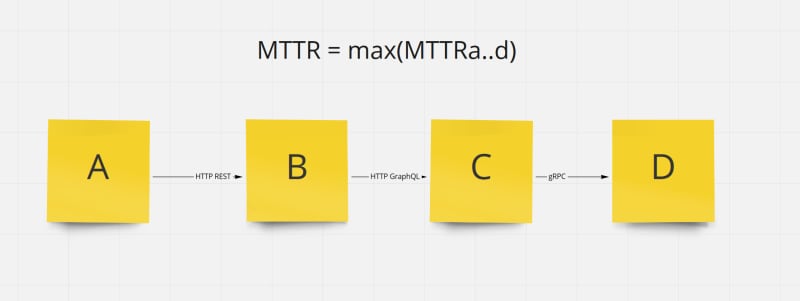
MTTR is unlikely measurable through a pipeline. We are not measuring the time to fix a build, but to restore a service. Nowadays with distributed architectures and X-as-a-Service, with chained many-to-1 direct dependencies between deployment units, this metric will fall to the minimum guaranteed value.
Deployment Frequency is not delivery frequency. We are measuring how many times we deploy changes, but they might be disabled under a feature toggle. This definitely means that we are measuring technical performance, but it’s not directly correlated to business performance of a team.
Change Failure Rate is a tricky one as it needs a common understanding of what Failure means. It seems that there is a convention on reducing the concept of failure to pipelines, however, this will not measure the team reliability on delivering features. To measure team reliability, we would need to link builds, with releases, and a way to build a relationship between a service failure (or bugs) with a release.
Lead Time For Changes is also really tricky, as changes can not be considered delivered until they are serving the customer. Changes deployed but disabled under a feature toggle can not be measured. This information is usually not available in the pipeline.
As you can see, those challenges are even difficult for high-performers as they require a lot of insights from live systems, and most of this information is usually not easily available. I will share more on the technical considerations later.
Four Key Metrics do not measure team performance
They are biased towards specific deliverables or artifacts. It’s even common to have a team, be a medium or high performer in an artifact, but low performer in other artifact. If you are in a transformational phase in your organisation, teams will be working in different environments depending on the business unit. A common scenario is a team which has a service in new infrastructure and works also in legacy systems. This can lead to situations where teams are frustrated by comparison and decrease their performance even more on legacy systems.
So the question is, do the four key metrics measure team performance, or the business unit performance? Is a team's fault to be underperforming on a legacy system, but performing well on another business unit? What happens if we have two teams working together in the same business unit and they have different four key metrics?
Four Key Metrics are best used to understand the dynamics of a business unit. It has been proved that a good score on the four key metrics allow teams to manage volatile business units. Organisations can strategically use those key metrics to improve their dynamics and take advantage of the volatility of their core domain, improving the overall performance.
Automating Four Key Metrics
Four Key Metrics should definitely be gathered from live systems, however, we still don’t have the tools to do that easily. Most companies are building infrastructure around their own services to gather them or instrumenting their pipelines to push new metrics to their dashboards.
It should be possible to have a platform to gather those metrics at an organizational level, however, the challenges are various:
What kind of service failure needs to be recovered depends on the team.
Availability depends entirely on the business unit, and a single deployment unit can affect multiple business units.
Also, different services can affect a single business unit by transitive dependencies and cascade failure on distributed architectures relying on peer-to-peer direct communications (like HTTP, gRPC communication). Availability can be partially guaranteed with circuit breakers, reducing consistency.
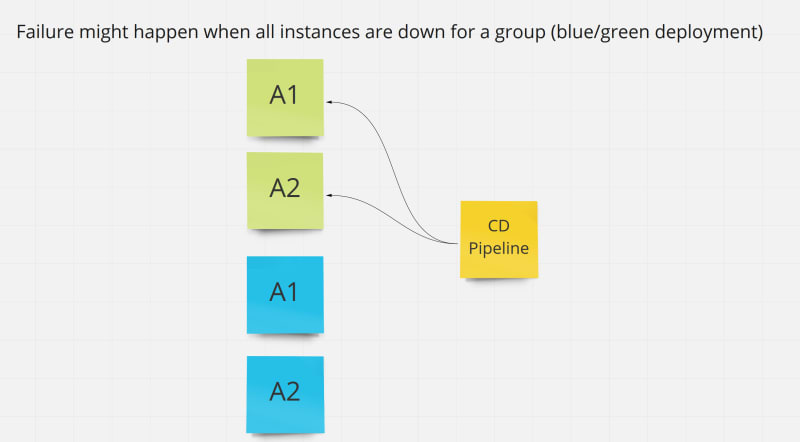
There can be multiple deployments of the same service (horizontal scalability)

There can be multiple versions of the same service (canary releasing)
With all that complexity in mind, the technical solution for gathering these metrics needs to challenge a lot of essential complexity and a lot of answers. I propose a, yet untested, possible solution that can be taken incrementally.
First the considerations: the information that we need to measure the four key metrics is not in a single place. It’s scattered all over different systems, and polling this information from multiple sources would be unmanageable. If we need to get the information of a commit, and the information of when it was deployed (probably across your cloud infrastructure, if any and in your pipeline), and their live status, we would get with a picture like this:

The complexity increases exponentially with different CI/CD services (GoCD, Jenkins, Github Actions, Travis, Gitlab, add your own), different deliverable unit infrastructures (AWS EC2, AWS ECS, Azure K8S, GCP K8S, Heroku) and different git repositories platforms (Github, Gitlab, Bitbucket). For that reason, it would be reasonable to change the model to a more centric and push-based system, with a single source of information.
For this platform, most prominents Cross Functional Requirements are not important:
Availability is not important, the service can be down for hours or days, data is not critical.
Performance is not an issue, any low-level instance in any cloud provider can support the required throughput. A delay of hours or days in processing the data is not a problem.
Security might not be an issue because there shouldn’t be any sensitive information.
Scalability wouldn’t be an issue: the load will be quite low as most of those metrics require user interaction. Organisation pipelines are going to throttle the load by themselves, as they are naturally inefficient compared to computers.
In my experience, what would be the most important Cross Functional Requirements would be Privacy, because those metrics can be taken easily to monitor individual or team performance by toxic organisations, breaking the safe-space.
The topology I would recommend is a manifest, living together with the artifact that has been deployed, so it can be pulled by an agent and sent to a metric hub. Something similar to this:

This metric hub can be something home-made, a statsd server, or a Prometheus cluster (or whatever similar technology) that can aggregate those metrics and send them to your dashboard of preference (Grafana, DataDog, New Relic…). A more detailed picture would be:

The CD Pipeline would write down a Manifest file that will contain the change-log of the deployment and some important information about the deployment context (for example, canary / full release deployments).
This information would be readily available to a Metric Agent that will be hosted with the deliverable unit (for example, a Pod, similar to a sidecar pattern) that will expose the information to the Metric Hub.
Going component by component, this would be a short summary of the responsibilities:
The Manifest is a potentially static document that will contain information about the current deployment. This information will be filled by the CD pipeline and will be part of the build artifact:
- Context: canary / full release
- Team Name
- Deliverable Name
- Build Id
- Change set (a list of)
- Commit Hash
- Timestamp of the Commit
The Metric Agent, should be a lightweight daemon that will pull information from the Manifest and register to the Metric Hub.
The Metric Hub, or Metric Registry, would be responsible for aggregating the information of different metric agents. Probably it should be a thin layer on top of a statsd server or a Prometheus.
The Liveness probe would be responsible for notifying the Metric Agent of any change in the status of a business unit. Usually a service will be part of a single business unit, but for legacy systems, this is a must (as most business units are part of this single artifact). The liveness probe can be implemented as simple health-checks, so they can also be used from load balancers.
Summary
- Four Key Metrics are not Continuous Delivery metrics.
- Four Key Metrics can be intentionally used by organisations to design business units.
- Four Key Metrics are a challenge by themselves, are hard to measure, and even harder to automate, making them unreasonable for low-performers without support.
- Using Four Key Metrics to measure a single team performance, without considering the business unit, may be troublesome.
- Four Key Metrics are also a good indicator of the architecture excellence, MTTR is key in this area.

Top comments (7)
An interesting article. I've seen similar metrics discussed previously but not in this form.
My main thought is the 4 Key Metrics are symptoms of quality / high-performance rather than definitions. Teams which perform well will often fulfill the 4 Key Metrics, but in my experience there are also plenty of teams who can deliver rubbish, which 'builds' regularly. In theory they fulfill the 4 Key Metrics, but they are not necessarily delivering quality / value or performing well.
The 4 Key Metrics obviously play a part in tracking performance, but of course the topic as a whole is much broader.
Thanks for this excellent discussion of the four key metrics. I‘d like to add that from a Performance Indicator point of view, these metrics are somewhat between „activity“/„process“ and „output“ focused, I.e. they are not „outcome“ and „impact“ focused. I also can‘t see them predicting good outputs/impacts (not leading indicators), so they are at best indicators of maturity with the shortcomings you point out.
I totally agree with you. These metrics are about technical maturity, not business impact.
I like your Post It Flow Chart. How is it done?
I use a web application named miro (miro.com). It has a free version for 3 whiteboards than you can fill with a lot of info.
Must have!
In that first chart, what does "commodity" mean, I can't find it defined as an adjective.
In this context it means 'how easy is to adopt in the market'. For example, is easier to adopt Manual Deployments or a Git* Repository than a CD pipeline (that's why they are on the right side).