
In this comprehensive guide, you will gain insight into the process of seamlessly integrating Prometheus and Grafana within your Kubernetes environment using Helm. Furthermore, you’ll discover how to construct a straight forward dashboard in Grafana. Prometheus and Grafana stand as two highly favored open-source monitoring solutions for Kubernetes.
Acquiring the skill to deploy them via Helm empowers you to efficiently oversee your Kubernetes cluster and swiftly resolve issues. This proficiency will also deepen your comprehension of your cluster’s overall health and performance, allowing you to diligently monitor resource allocation and performance metrics in your Kubernetes environment.
Prerequisites
To get started with this guide, make sure you have the following prerequisites:
- Docker Installation: Follow the official Docker documentation to install Docker on your machine.
- Kubectl Installation: Install Kubectl on your local machine for communication with your Kubernetes cluster. Refer to the official Kubectl documentation for guidance.
- Basic Kubernetes Knowledge: It’s helpful to have some fundamental knowledge of Kubernetes. You can either consult the Kubernetes official documentation or access Semaphore’s free ebook titled “CI/CD with Docker and Kubernetes,” which doesn’t require prior Docker or Kubernetes expertise.
- Kubernetes Cluster Setup: You’ll be deploying Prometheus and Grafana on your Kubernetes cluster. In this guide, we’ll use Minikube, a free local Kubernetes cluster. Alternatively, you can opt for managed cloud-based Kubernetes services such as Google Kubernetes Engine (GKE), Azure Kubernetes Service (AKS), Amazon Elastic Kubernetes Service (EKS), or DigitalOcean Kubernetes Service (DOKS). Keep in mind that some of these cloud-based services may involve a cost, while others offer free plans.
By meeting these prerequisites, you’ll be ready to integrate Prometheus and Grafana seamlessly into your Kubernetes environment.
What is Prometheus?
Prometheus stands as an open-source DevOps utility, offering robust monitoring and real-time alerting features tailor-made for container orchestration platforms like Kubernetes. This tool excels in collecting and storing metrics as time series data, making it an ideal choice for tracking and analyzing platform performance. One of its standout attributes is its innate ability to monitor the container orchestration platform, making it an invaluable data source for various data visualization libraries, including Grafana.
The metrics Prometheus captures from the Kubernetes cluster encompass:
- Health status of the Kubernetes cluster.
- CPU utilization statistics.
- Memory consumption metrics.
- Node status within the Kubernetes infrastructure.
- Insights into potential performance bottlenecks.
- Performance metrics.
- Resource allocation and utilization across server components.
In essence, Prometheus plays a pivotal role in ensuring the health and performance of a Kubernetes cluster, making it an essential tool for DevOps and system administrators.
What is Grafana?
Grafana is a versatile, open-source tool for visualizing data. When it’s connected to data sources like Prometheus, it offers features like interactive dashboards, charts, graphs, and web alerts. You can use Grafana to view and understand your data from various sources, not just Prometheus, including InfluxDB, Azure Monitor, and others.
You can build your own dashboards or use pre-made ones and customize them as needed. Many DevOps professionals use Grafana and Prometheus to create powerful databases and visual displays for tracking data over time. In this guide, we’ll show you how to make a dashboard for visualizing metrics from Prometheus.
Choosing the Right Deployment Method for Prometheus and Grafana Integration on Kubernetes
- Manual Kubernetes Deployment: In this method, you’re required to create Kubernetes Deployment and Services YAML files for both Prometheus and Grafana. These YAML files must include all the necessary configurations to enable integration with Kubernetes. Subsequently, you deploy these files to your Kubernetes cluster to make Prometheus and Grafana operational. This process may result in multiple YAML files, which can be somewhat burdensome for many DevOps professionals. Additionally, a single mistake in any YAML file can impede the integration of Prometheus and Grafana on Kubernetes.
- Using Helm: This stands out as the simplest and most convenient method for deploying applications in containers to Kubernetes. Helm serves as the official package manager for Kubernetes and streamlines the installation, deployment, and management of Kubernetes applications. Helm packages and encapsulates the Kubernetes application within a Helm Chart. A Helm Chart encompasses all the essential YAML files, including Deployments, Services, Secrets, and ConfigMaps manifests. These files are instrumental in deploying the application container in Kubernetes. Instead of crafting individual YAML files for each application container, Helm offers the convenience of downloading pre-existing Helm charts that come equipped with the necessary manifest YAML files.
Installing Helm
Before you install Helm, you must start your Minikube Kubernetes using the following command:
- Installing Helm on macOS
brew install helm
- Installing Helm on Linux
sudo apt-get install helm
- Installing Helm on Windows
choco install Kubernetes-helm
Helm Commands
To get all the Helm commands, run this command:
helm
The command output:
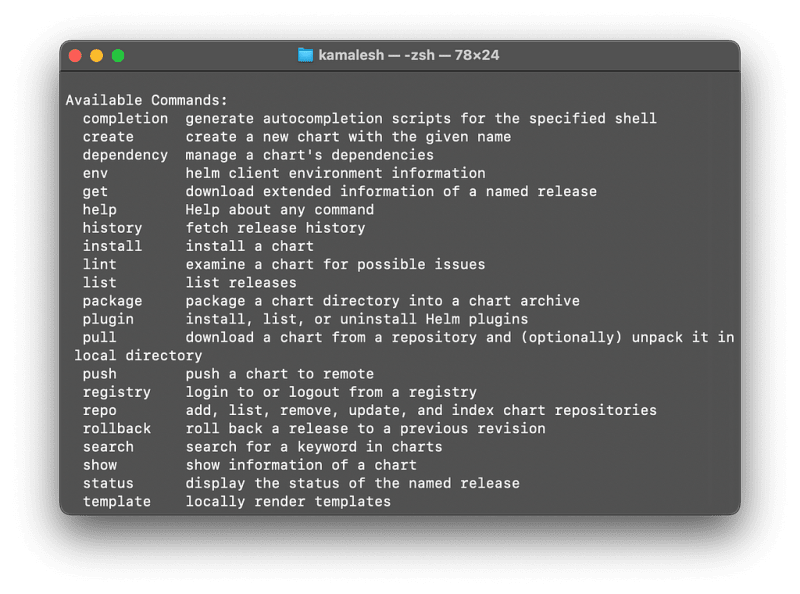
Helm commands
Here are the fundamental Helm commands:
- helm search: Search for Helm Charts in the ArtifactHub repository.
- helm pull: Retrieve and download a Helm Chart from the ArtifactHub repository.
- helm install: Upload and deploy a Helm Chart to your Kubernetes cluster.
- helm list: Display a list of all deployed Helm charts within your Kubernetes cluster.
Prometheus Helm Charts
- Let’s begin by searching for the Prometheus Helm Charts. To find the Prometheus Helm, use the following command:
helm search hub prometheus
The command lists the following Prometheus Helm Charts:

Prometheus Artifacts
You can also go to the ArtifactHub repository and search for the official Prometheus Helm Chart as shown in the image below:
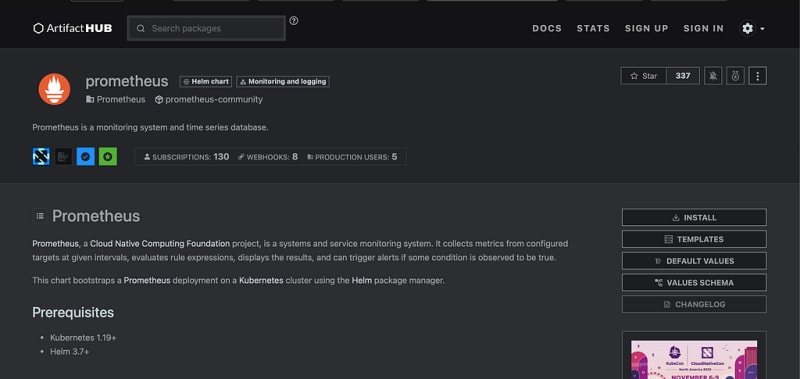
Artifacts site
The first one on the list is the official Prometheus Helm Chart. To get this Helm chart, run this command:
helm repo add prometheus-community https://prometheus-community.github.io/helm-charts
helm repo update
Install Prometheus Helm Chart on Kubernetes Cluster
To install Prometheus Helm Chart on Kubernetes Cluster, run this helm install command:
helm install prometheus prometheus-community/prometheus
After successfully installing Prometheus on your Kubernetes Cluster, you can access the Prometheus server via port 80. The subsequent task is to inspect the Kubernetes resources that have been deployed. These resources consist of the pods and services generated by the Helm Chart within your Kubernetes cluster.
To examine the deployed Kubernetes resources, execute the following kubectl command:
kubectl get all

The installation of the Helm Chart results in the creation of several essential Kubernetes resources, including:
- Pods: These pods host the Prometheus Kubernetes application within the cluster.
- Replica Sets: A collection of instances of the same application inside the Kubernetes cluster, enhancing application reliability.
- Deployments: These deployments serve as the blueprint for creating application pods.
- Services : Services are responsible for exposing the pods running within the Kubernetes cluster, allowing us to access the deployed Kubernetes application.
The subsequent action involves accessing and launching the Prometheus Kubernetes application. You can access the application through the Kubernetes services designated for Prometheus. To obtain a list of all the Kubernetes Services associated with Prometheus, execute the following command:
kubectl get service

Exposing the prometheus-server Kubernetes Service
To expose the prometheus-server Kubernetes service, run this command:
kubectl expose service prometheus-server --type=NodePort --target-port=9090 --name=prometheus-server-external
This command will convert the ClusterIP type to the NodePort type. It makes the prometheus-server accessible outside the Kubernetes Cluster on port 9090.
Now we have exposed the prometheus-server Kubernetes service. Let’s access the Prometheus application using the following command:
minikube service prometheus-server-external
Please be aware that it may require some time for the URL to become accessible. You might need to make multiple attempts in your web browser until you successfully access the Prometheus Kubernetes application through the provided URL. It’s important to keep the terminal open and the tunnel command running to ensure continuous access to the service.

With Prometheus successfully installed on Kubernetes via Helm, Prometheus is up and running within the cluster, and it’s accessible through a browser via a URL. Moving on to the next steps in the tutorial:
- We will proceed to install Grafana.
- Subsequently, we’ll establish the integration between Prometheus and Grafana. Grafana will utilize Prometheus as its primary data source.
- Finally, we will employ Grafana to craft the dashboards essential for monitoring and observing the Kubernetes cluster.
Install Grafana
To install, we follow the same steps as those for installing Prometheus:
Search for Grafana Helm Charts
To search for the Prometheus Helm charts, run this command:
helm search hub grafana
You can also go to the ArtifactHub repository and search for the official Grafana Helm Chart as shown in the image below:

To get this Grafana Helm chart, run this command:
helm repo add grafana https://grafana.github.io/helm-charts
helm repo update
Install Grafana Helm Chart on Kubernetes Cluster
You’ll run this helm install command:
helm install grafana grafana/grafana
We have installed Grafana on the Kubernetes Cluster. We can access the Grafana server via port 80. The next step is to access and launch the Grafan application. You will access the application using the Kubernetes services for Grafana. To get all the Kubernetes Services for Grafana, run this command:kubectl get service
Exposing the grafana Kubernetes Service
To expose the grafana Kubernetes service, run this command:
kubectl expose service grafana --type=NodePort --target-port=3000 --name=grafana-ext
This command will convert the ClusterIP type to the NodePort type. It makes the grafana accessible outside the Kubernetes Cluster on port 3000. Now we have exposed the grafana Kubernetes service. Let’s access the Grafana application using the following command:
minikube service grafana-ext

The image above shows the Grafana Login page. To get the password for admin, run this command on a new terminal.
kubectl get secret --namespace default grafana -o jsonpath="{.data.admin-password}" | base64 --decode ; echo
Login into Grafana
To login into Grafana, input admin as the user name and your generated password. It will launch a Welcome to Grafana home page as shown below:

To add Prometheus as the data source. To add Prometheus as the data source, follow these steps:
- On the Welcome to Grafana Home page, click Add your first data source:
- Select Prometheus as the data source:
- You will then add the URL where your Prometheus application is running. This is the first URL (internal to the cluster) shown when we ran minikube service prometheus-server-external earlier.

- Click the “Save & test” button to preserve your modifications.
With that, you have successfully completed the integration of Prometheus and Grafana on Kubernetes using Helm. The final phase involves crafting a Grafana Dashboard, a pivotal step in visualizing the metrics for your Kubernetes cluster.
Grafana Dashboard
- As previously mentioned, you have the flexibility to either create your own dashboards from the ground up or import existing ones provided by Grafana. In this section, we’ll walk you through the process of importing a Grafana Dashboard. To import a Grafana Dashboard, follow these steps:
Retrieve the Grafana Dashboard ID from the public Grafana Dashboard library.
Kubernetes Monitoring with Grafana
- On this web page, search for Kubernetes:
- Scroll until you find the Kubernetes cluster monitoring (via Prometheus) dashboard
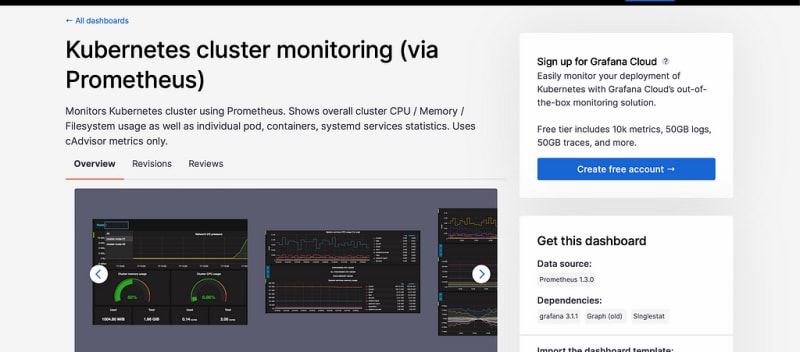
- Select Dashboard and copy the Dashboard ID:
- Go Back to Grafana and click Home on the top left corner:
- It will display a menu.
On the menu, click Dashboards
- Click New
- It will display three options: New Dashboard, New Folder and Import.
- Click Import
- dd the Grafana ID: You will add the Grafana ID that you have copied and click Load. The Grafana ID is 315.

It will the launch the Dashboard shown below:

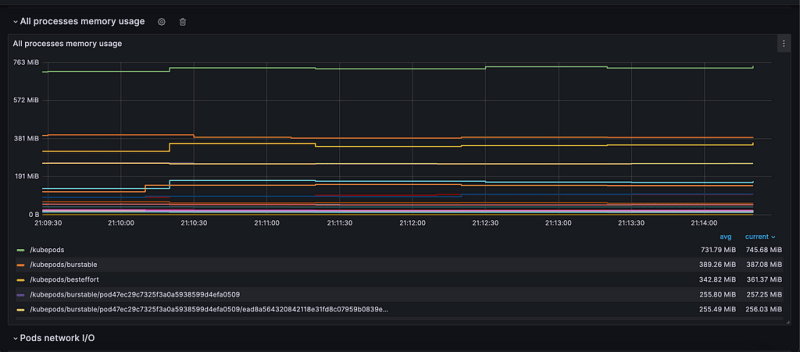
You use this dashboard to monitor and observe the Kubernetes cluster metrics. It displays the following Kubernetes cluster metrics:
- Network I/O pressure.
- Cluster CPU usage.
- Cluster Memory usage.
- Cluster filesystem usage.
- Pods CPU usage.
Advantages of Configuring Prometheus and Grafana for Container Orchestration Platform Monitoring
The deployment of Prometheus and Grafana for monitoring purposes offers several notable benefits:
- It delivers a comprehensive, all-encompassing solution for monitoring and overseeing a Kubernetes cluster.
- You gain the capability to perform metric queries using Prometheus’s PromQL query language, facilitating in-depth analysis.
- In the context of a microservices architecture, Prometheus efficiently tracks all your microservices concurrently, ensuring no aspect goes unmonitored.
- Immediate alerts are triggered when a service encounters a failure, allowing for swift corrective actions.
- The Grafana dashboard provides comprehensive performance and health reports for your clusters, offering valuable insights and visual representations of your system’s state.
Conclusion
In this comprehensive guide, you’ve acquired the knowledge needed to seamlessly integrate Prometheus and Grafana into your Kubernetes environment using Helm. Furthermore, you’ve gained insights into creating a straightforward dashboard in Grafana, enabling you to monitor resource utilization and performance metrics across your Kubernetes cluster.
Monitoring plays a pivotal role in DevOps, ensuring that you maintain visibility into your Kubernetes cluster and the performance of microservices. Implementing these practices is essential for real-time updates on your cluster’s health, allowing you to stay informed about its current status.
That brings us to the conclusion of this Prometheus and Grafana guide. Thank you for reading, and here’s to your continued learning and success!

Top comments (0)