Today I'm launching PM2 DevTools, a browser extension that allows you to manage PM2 processes and logs from your browser. This has been a fun side project for me, and while I realize the demographic for a tool like this is likely pretty narrow I'm still excited to show it off.
PM2 DevTools was born out of a desire to interact and do something with the logs FxA produced without needing to leave the browser. Specifically, when you sign up for a new account you need to enter an account verification code in the browser, and locally this is printed in one of the process logs.

PM2 DevTools will allow me to now script my way through this flow -- from CLI output to browser input.
Pretty specific use-case, right? Maybe, but depending on what your PM2 logs produce and your imagination I'm sure there are a bunch of things you could automate.
You can go download it from Firefox Add-ons right now and try it out. I even put together a little example PM2 project you can use.
Manage processes, observe logs, automate page actions
As soon as you run PM2 DevTools it starts a background script that attempts to connect to the PM2 WebSocket server. The WebSocket is responsible for delivering all the data used by the extension, such as listing processes and streaming log data. Once that connection is made it is maintained until the browser is closed. If configured, logs may start flowing in and the script evaluates each log event against any of the tabs you have open with any Log Scripts you have saved (more on this later). Otherwise, the background script lies in wait for a connection to be made from the part of the extension that you'll interact with: the panel.
The main part of PM2 DevTools is, well, the dev tool! This extension adds a new panel to your Developer Tools, and it's where most of the features can be observed and settings managed. When you open it the panel connects to our background script and asks it to retrieve all the PM2 processes, which in turn asks the WebSocket for this information. As you can see the background script acts as a relay between the WebSocket and Developer Tools panel.
The extension supports both dark and light modes. Documentation on all the settings can be found here.
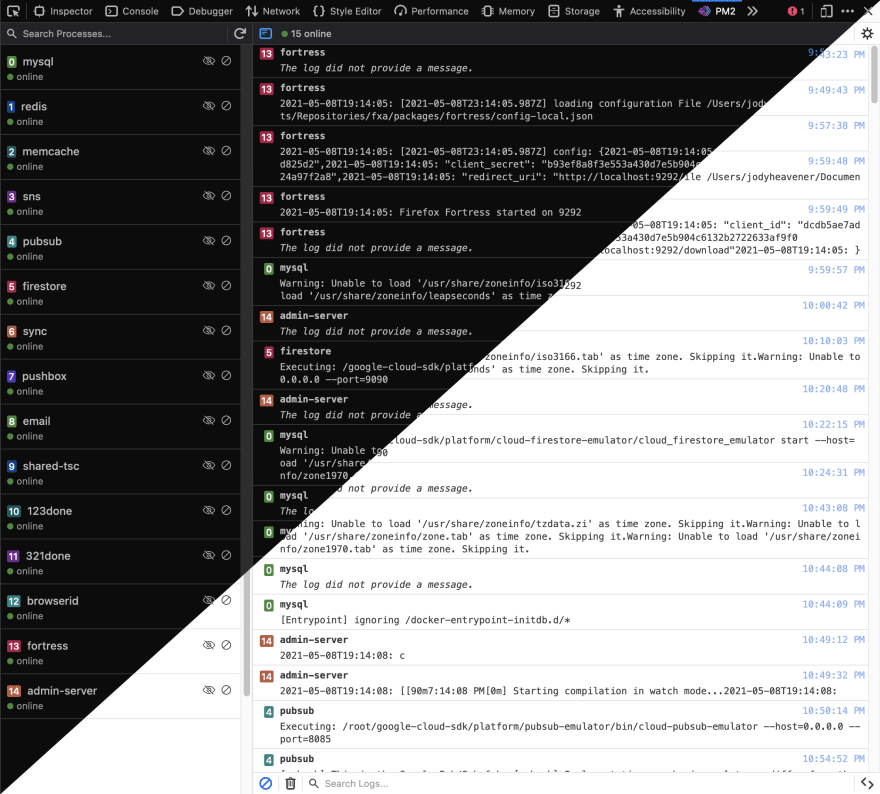
Simple process-management UI
With this extension all your processes are available in a simple sidebar UI. This UI is kept up-to-date at all times via the WebSocket, reflecting new processes, as well as changes to their status. Each process cell provides important details like name, identifier, and status.
To help distinguish between large numbers of processes and their logs, each process is also automatically color-coded.

Managing a process is simple - just click the play or pause button in its cell, depending on its status, to turn it on or off. Click the eye icon to exclude its logs from the output window, including search results; this is helpful for services that are a little too chatty.
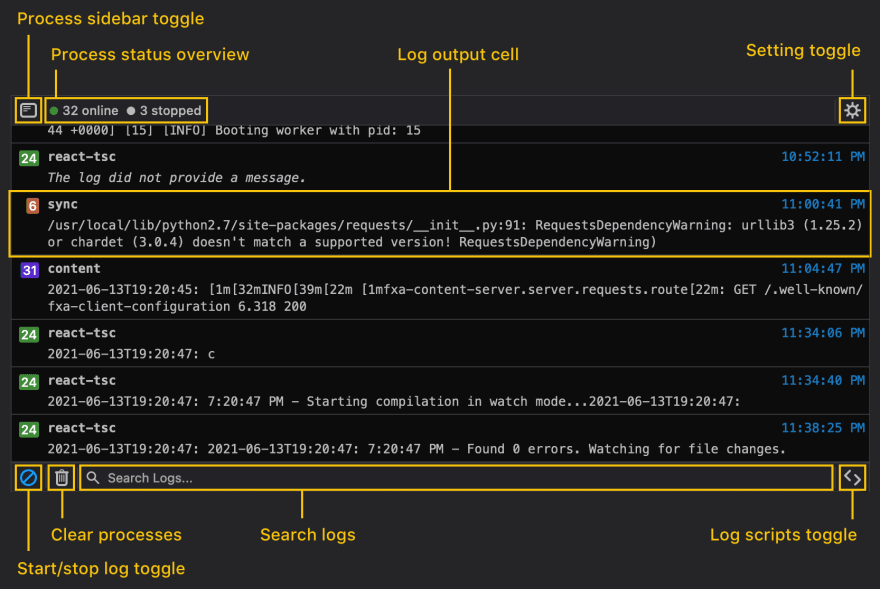
Inspect, search, and automate with your logs
As you might expect, the main component of PM2 DevTools is the log output, and it's the visual equivelent of pm2 logs in the CLI, with some added functionality.
When the "Start logs" play button is toggled color-coded process logs will stream in via WebSocket connection. As noted earlier, specific processes can be excluded as desired. You'll also see extension-level logs appear here, such as when a connection is made or lost to the WebScoket server, or if an error occurs under the hood.
You can of course clear all logs, as well as search through them. The search field supports process name and log content, and it also treats a string between two forward slashes as a regex query.
Log Scripts
In the bottom right you'll see a script tags button; clicking this will take you to Log Scripts.
Log Scripts are JavaScript snippets that can be executed when PM2 logs are broadcast. When the extension's background script receives a new log event it will check to see if any Log Scripts have matching URLs and then execute the script's code, which will have access to the log's data, directly on the page.
These scripts can be really powerful when flows in the browser rely on output from process logs. If you think back to the scenerio described above, where we want to look up a verification code in process logs and use it in a browser field, we can now automate this with a Log Script:
if (data.name !== "inbox") { return; }

const field = document.querySelector(".otp-code");
const button = document.querySelector("#submit-btn");
const regexp = /^.+Signin code (\d+).+$/;
const match = data.message.match(regexp);
const code = match[1];

if (field && button && code) {
  field.value = code;
  button.click();
}
So what's happening here? Well, it's a function body that's evaluated directly on any page (so be careful!) with a matching URL.
Any time a process log arrives the background script looks up all available Log Scripts, checks if any of the URLs from pages you've got open match (this can also be a glob), and if so executes that Script's function body with the log data passed in as the data object directly on the page. This object looks like:
{
  "message": "some output from the service",
  "timestamp": 1619810341487,
  "pmId": 15,
  "name": "auth-db"
}
With this log script saved now all I have to do is run through the flow locally.
Documentation on setting up Log Scripts can be found here.
Ultimately, as I mentioned, the audience for this is probably pretty small, but I had so much fun diving into the world of browser extensions. I'd love to know what you think, and if you have any suggestions!

Top comments (0)