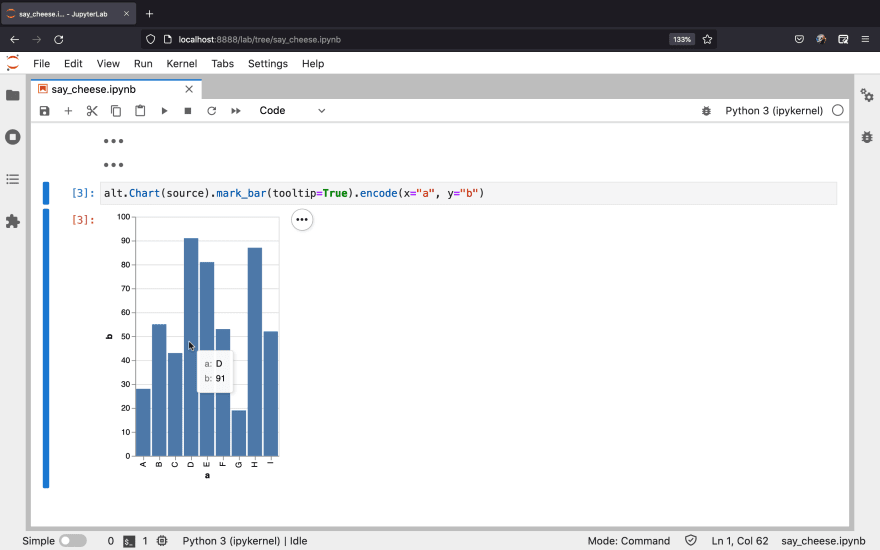
When we add a tooltip to a chart in Altair, as in the example below, it follows a light theme by default. This tooltip implementation comes from Vega Tooltip, a plugin included in Vega-Embed (the package used under the hood to render the charts).
import altair as alt
import pandas as pd

source = pd.DataFrame(
    {
        "a": ["A", "B", "C", "D", "E", "F", "G", "H", "I"],
        "b": [28, 55, 43, 91, 81, 53, 19, 87, 52],
    }
)

alt.Chart(source).mark_bar(tooltip=True).encode(x="a", y="b")
In addition to the light theme, Vega Tooltip also has another predefined theme: the dark theme. To use the dark theme, let's set one of the Vega-Embed options to do so, similar to when we configured Vega-Embed for a single Altair chart:
metadata = {"embedOptions": {"tooltip": {"theme": "dark"}}}
Now, considering the chart we created at the beginning, we just need to pass the dictionary defined above as an argument to the properties() method:
alt.Chart(source).mark_bar(tooltip=True).encode(x="a", y="b").properties(
    usermeta=metadata
)
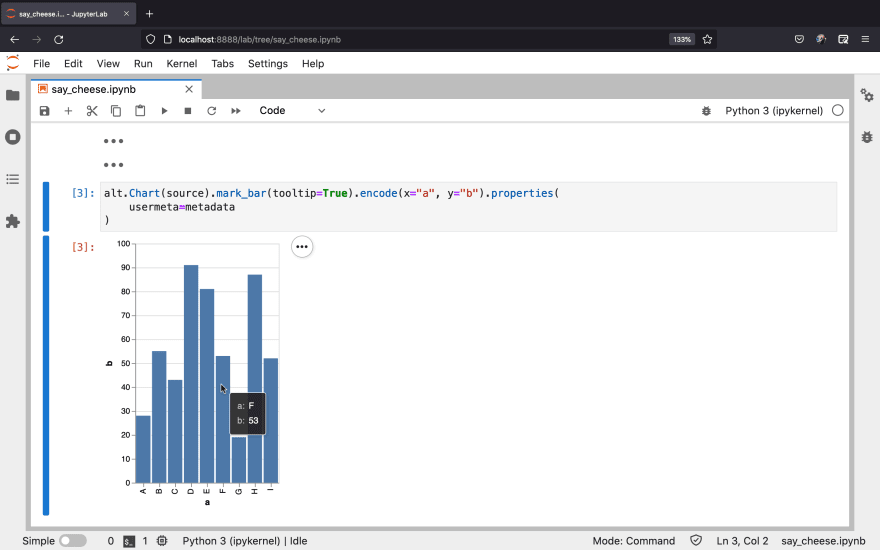
As a result, the tooltip will look like this:
On the other hand, to enable the dark theme globally for all charts in a notebook, for example, it is a matter of running the following snippet initially:
alt.renderers.set_embed_options(tooltip={"theme": "dark"})
Finally, if you have any questions or suggestions, feel free to leave a comment below!


Top comments (0)