
1. What is Matplotlib
Matplotlib is a popular data visualization library in Python widely used for creating static, interactive, and animated visualizations in Python. We can represent our data in many interactive ways like Graphs, Histograms, Pie Chart, etc.
2. Why Matplotlib
It provides a wide range of customization options to make your graphs more informative and visually appealing. Here are some of the customization options available in Matplotlib:
- Adding markers
- Changing kind of graph
- Adding labels and titles
- Adding legends
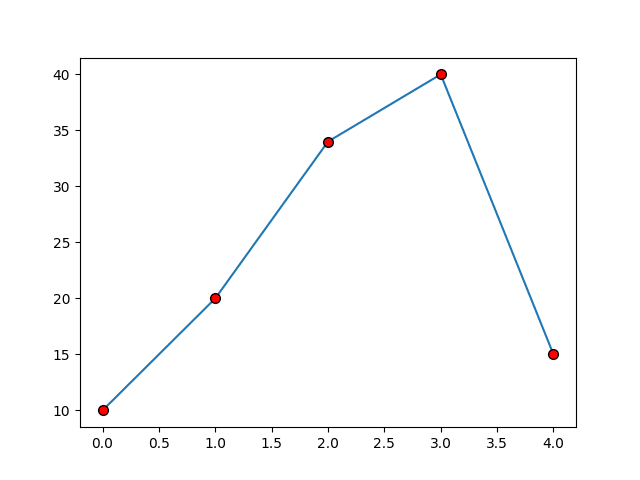
3. Using markers in graphs
Markers in Matplotlib are used to represent data points on a plot with a symbol, such as a circle, square, or triangle. We can perform various function and customizations using keyword *marker * like:
- Changing the marker size
- Changing the marker color
- Changing the marker edge color and width
Syntax
import matplotlib.pyplot as plt
import pandas as pd

ypoints = [10,20,34,40,15]

plt.plot(ypoints, marker = 'o', markeredgecolor='black', markersize=7, markerfacecolor='red')
plt.show()
Output
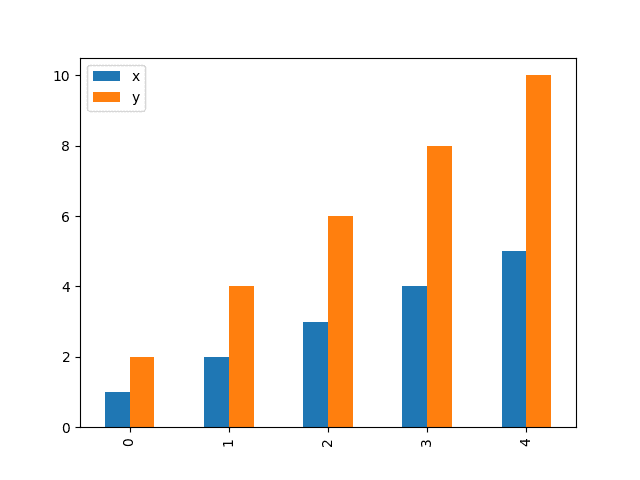
4. Different kind to represent our data
We can represent our data in many interactive forms like:
Pie charts, Histograms, BarCharts, etc. using a keyword kind.
Note
Kind of graph is written as a string.
Syntax
import matplotlib.pyplot as plt
import pandas as pd

data = {'x': [1, 2, 3, 4, 5], 'y': [2, 4, 6, 8, 10]}
df = pd.DataFrame(data)
graph = df.plot(kind="bar")
plt.show(graph)
Output:
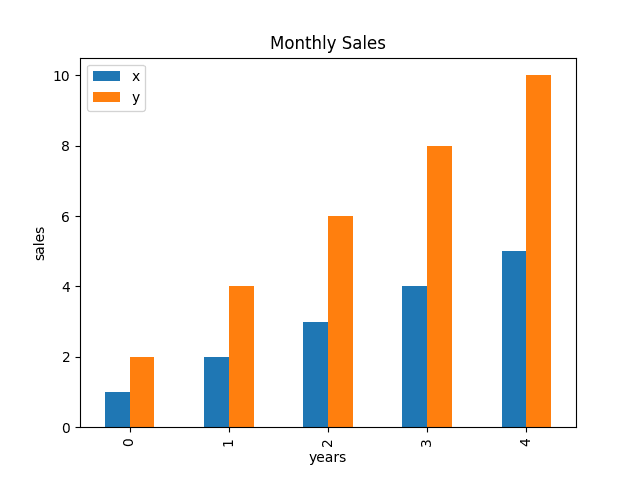
5. Labels and titles
Labels and titles are most important components of a Matplotlib plot, as they provide information about the data being visualized. They make the plot easier to understand. We can add labels both on x and y axis while title provides the plot to a name which becomes more informative.
Syntax
import matplotlib.pyplot as plt
import pandas as pd

data = {'x': [1, 2, 3, 4, 5], 'y': [2, 4, 6, 8, 10]}
df = pd.DataFrame(data)
graph = df.plot(kind="bar")
plt.title("Monthly Sales")
plt.xlabel("Years")
plt.ylabel("Sales")
plt.show(graph)
Output
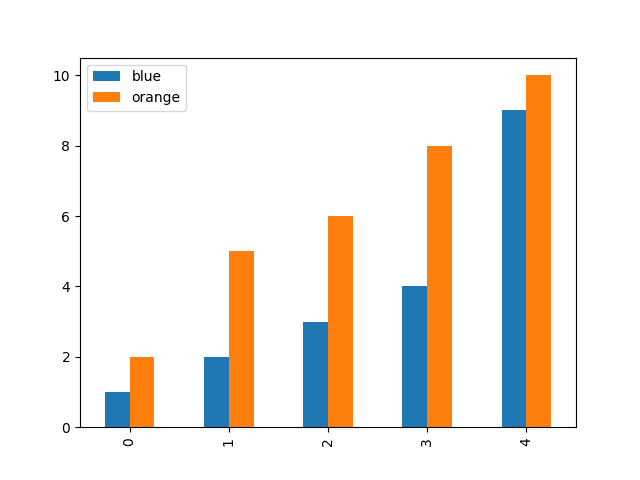
6. Customization using Legend
Legend is used to identify and distinguish between different plots in a figure. We can change the color of multiple bars which makes our plot more interactive and easier to understand.
Syntax
import matplotlib.pyplot as plt
import pandas as pd

data = {'x': [1, 2, 3, 4, 9], 'y': [2, 5, 6, 8, 10]}
df = pd.DataFrame(data)
graph = df.plot(kind="bar")
plt.legend(["blue","orange"])
plt.show(graph)
Output

Top comments (0)