
The JFrog DevOps Platform, powered by Artifactory 7, introduces a new unified experience across all JFrog products and services. Any JFrog product or service that you use today, including Artifactory, Xray, Mission Control, and Distribution can now be accessed through one central UI.
Here are just a few key items that you may come across in the new version!
Global Search Experience
New Packages View
Dashboard View
Consolidated Administration
Unified Permissions
Global Search Experience
Available to all users from OSS to Enterprise+. (Note: Security and Compliance search requires JFrog Xray, and Release Bundles search requires JFrog Distribution)

The JFrog Platform introduces a unified search experience for data across all JFrog Products.
Through one convenient search bar, you can select to search for packages, builds, artifacts, release bundles, or security/compliance information.
You can narrow your search through advanced search options that empower you to filter by name, package type, property, security vulnerability, and more.
New Packages View
Provides package native information for all package types supported by Artifactory (excluding Git LFS and Generic packages).
If JFrog Xray and/or JFrog Distribution are installed, vulnerability and software distribution information can be found directly in the packages tab.

In prior versions of Artifactory, the Packages UI provided information only for Docker and npm packages. With the release of Artifactory 7.x and the JFrog Platform, the Packages view includes all package types supported by Artifactory (excluding Git LFS and Generic packages). The package type list and more information can be found in the JFrog Platform package management documentation.
Dashboard View
With JFrog Mission Control installed the Dashboard provides you with two main components.
Topology Tab

The Topology Tab provides a visualization of all of your JFrog Platform Deployments (or JPDs) across the globe in a single pane of glass.
You can see the general health status of services, visualize replication and Access Federation connections across your topology, and drill down into more detailed information as you need.
Trends Tab

(Image: Storage Trends Example)
The Trends Tab provides in-depth health and performance information about your JPDs by tracking metrics around storage, security, distribution, and replication.
For more in-depth information please visit the JFrog Platform Dashboard documentation
Consolidated Administration
You will now be able to administer and manage all of the services within the JFrog Platform through one UI via this unified Administration panel.

For more information, read the JFrog Platform Administration module documentation
Unified Permissions
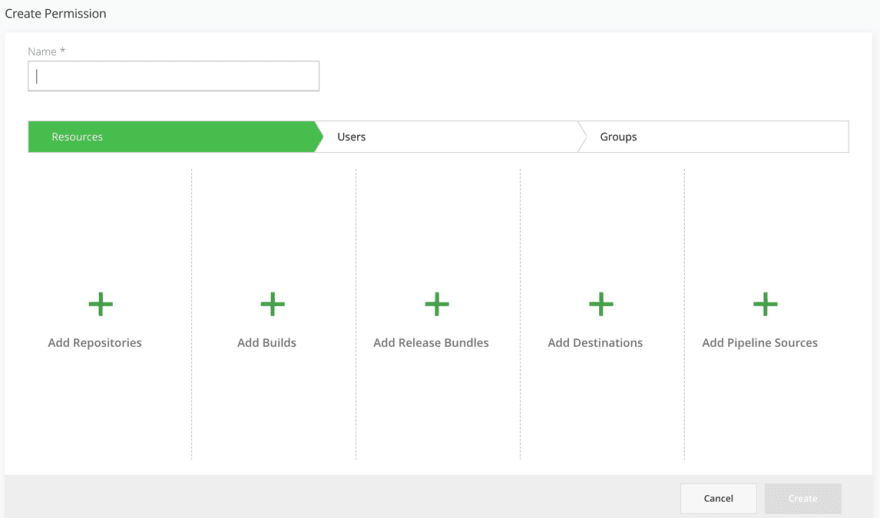
Unified permissions across repositories, builds, release bundles, destinations, and pipelines sources from various JFrog Products are encapsulated in one permission.
For more information, read the JFrog Platform permissions management documentation.
To see what else is new and to help you get started with the Unified JFrog Platform please visit: https://www.jfrog.com/confluence/display/JFROG/Get+Started.


Top comments (0)