
JFrog has released a Unified DevOps Platform, putting the entire product suite under one roof. You’ll have a comprehensive view of what’s going on with your artifacts, more clear permissions control, quicker access to your build pipelines, and my personal favorite: vulnerability scanning baked right in. Let me show you around!
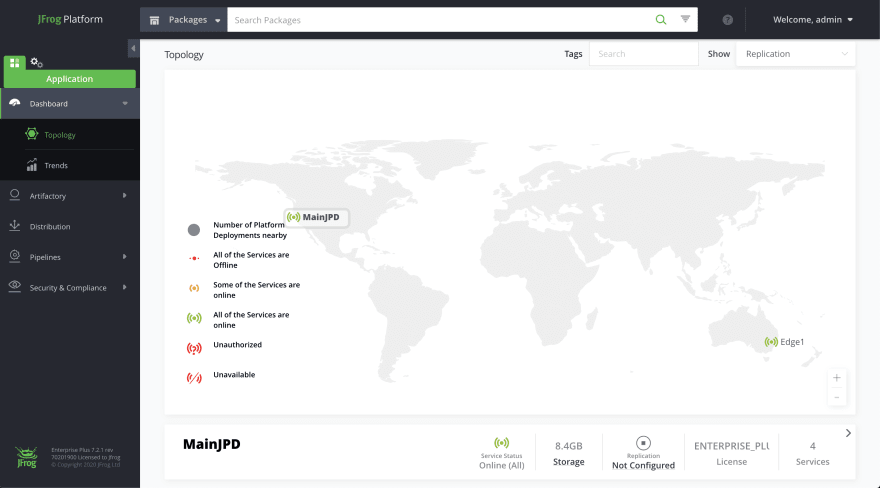
Looks pretty clean, right? One login gets you access to the entire platform. Your dashboard provides some high-level information on the status of your services, plus usage trends across package types. On the left, you have direct access to your JFrog services: Artifactory, Distribution, Pipelines, and the one I’ll be talking about: Xray.
JFrog Xray is a universal component DevSecOps tool that protects you from security vulnerabilities and license compliance issues that may be hidden in your software. Let’s take a look at the Security and Compliance tab to see how we can automatically trigger warnings, fail a build, or even block downloads based on a threshold you set.
JFrog Xray functions on a system of Policies and Watches. Policies allow us to define security and license compliance behaviors specific to your organization. Once they are defined, they are enforced by applying them to Watches.
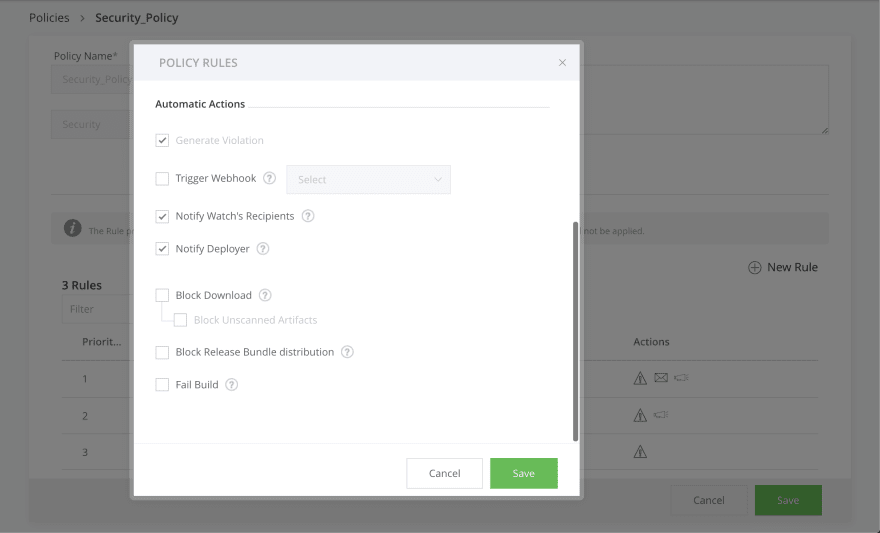
In this case, the Policy is triggered when a vulnerability categorized as “high” is found. Xray’s scan is recursive, so it looks at the smallest components affecting your packages. Its vulnerability database is multi-faceted, using public information, its own private database, and Risk Based Security’s VulnDB. If the vulnerability is known, it’ll find it. This information is presented to you in a couple of places, but the easiest to digest is in the form of an Impact Analysis Graph, which I’ll show you later.
Once a Policy has been defined, you must assign it to a Watch. A Watch is a collection of repositories, builds, and release bundles that Xray should be scanning. I like to organize these by project, but it’s up to you how to handle that. Policies can be assigned to multiple Watches, so there’s no need to define a ton of them.
Now that you have a Policy and it’s assigned to a Watch, you’ll start to see Xray data in a few different places elsewhere within the Platform. The fact that everything is now organized within a single pane of glass makes staying on top of any potential security or license issues really, really easy. Let’s hop over to the Artifactory tab and take a look at what’s going on with some of our builds.
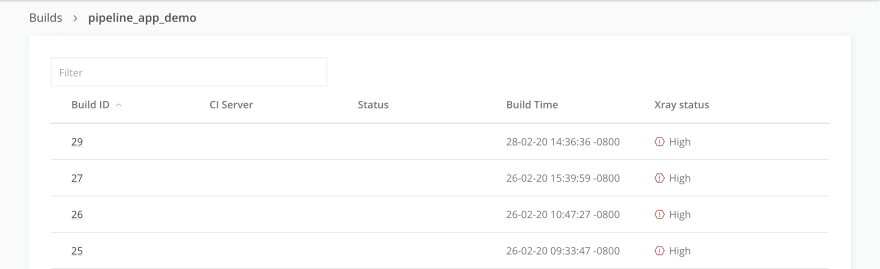
We can already see from here that there are some problems. Each of these builds has an Xray status of “high” -- something risky is happening with some component here. We need more information, though. What’s the actual vulnerability? Is this something we really need to act on? What specific component is causing the problem, and what version do we need to update it to if we want to resolve the vulnerability? Click on the build and find out.

Under the Xray Data tab for the most recent build, we get a TON of information. Everything that violates our set Security and License Policies is here. We get some high-level information immediately: a summary of the vulnerability, the severity, which Policy was triggered, the component in question, the affected versions, and the fix versions, if any. Click on one of them, and you get even more information.

On the right is the Impact Analysis Graph I mentioned earlier. Xray has peeled open our package and drilled down through the layers to find an issue with Jackson. To assist in resolving the vulnerability, we also get a description of the problem, references, CVEs, and more. You know exactly which component is causing a problem, and very clearly what the problem is. There’s no guesswork involved in fixing it, and this information is readily available to you no matter where you are in the Platform.
Collecting all of JFrog’s products into one platform gives your team a clear view into every aspect of your artifact’s lifecycle. Everything you want to know is easily within reach, in just a click or two. If you really care about automating away the trouble of dealing with security vulnerabilities and license violations, Xray is pretty compelling. Stay tuned for walkthroughs of the rest of the new JFrog Platform, and don’t hesitate to reach out to me if you have questions!

Top comments (0)