I run a web history newsletter called The History of the Web and I thought it might be fun to share some of what I write here. If you're interested in reading more you can sign up for the newsletter. Posts go out one the first and third Tuesday of the month!
If you’re a developer today, you likely take advantage of built in tools for web debugging every day. They came from the smallest places, and it took years to get them where they are today.
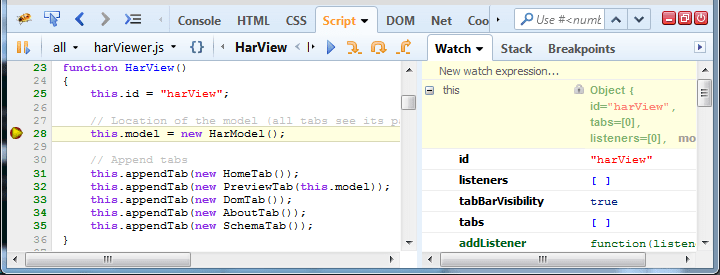
January of 2006 was a big month for web developers. On January 12, Joe Hewitt—a programmer with almost a decade of experience on the web as one of the original contributors at Netscape to the Firefox browser—announced something new he was working on. It was called Firebug, an extension of Mozilla that allowed developers to more easily debug the JavaScript and HTML of their webpages. Three days later, Webkit contributor Timothy Hatcher checked in a bit of code that added something similar to Webkit browsers like Apple’s Safari. The Webkit version was called Web Inspector.
The days of fly-by-the-seat-of-your-pants debugging were over. Web debugging and monitoring was all grown up.
It was a transformative moment for the web, but it was also a long time coming. In fact, being able to debug the languages of the web can trace its roots back to the earliest days of the web.
View Source is as old as the web itself. Go to any page on the web and find View Source in your toolbar and you will be magically transported under the hood of a website. A new window will appear that displays that page’s code, the raw HTML and CSS.
The ability to view source was available in some of the earliest web browsers. If not for that simple tool, many developers would have had no way to break into web development themselves. By making any webpage ostensibly open by default, web developers were able to get their start simply by hopping from page to page and taking a look at the code directly. It also became one of the earliest ways for developers to verify changes or issues on their site.
View Source works well enough for HTML. But when JavaScript was first adopted by Netscape, it required something different.
JavaScript’s creator, Brendan Eich, understood this well. The first example of debugging JavaScript is also the first example of JavaScript’s public use. To demo the capabilities of the language, Eich opened up a browser, typed a JavaScript command into its address bar, and an alert window popped up in a custom frameset, in a crude example of what would eventually be known as a JavaScript console.
As a page renders and changes based on the code that’s written, output and errors can be logged directly to text and output onto the webpage itself. That functionality is known as a console. And it can do lots of things, but it’s most important function is to provide feedback about JavaScript code as it is executing. After all, JavaScript is dynamic, and so it’s output is constantly changing.
These two different rudimentary tools—view source and the JavaScript console—would serve as the templates for every generation of tools that came after it. Each time new software was released, it generally descended from one idea or the other.
For instance, some of the earliest HTML debuggers and validators used the fundamentals of view source to identify potential problems with the way markup was written. Tools that became known as DOM inspectors took this even further. Aardvark, first released in 2005, let you open up a webpage, highlight any element on the page, and instantly see the HTML and CSS associated with that element. It was phenomenally useful for designers attempting to trace the source of their webpages.
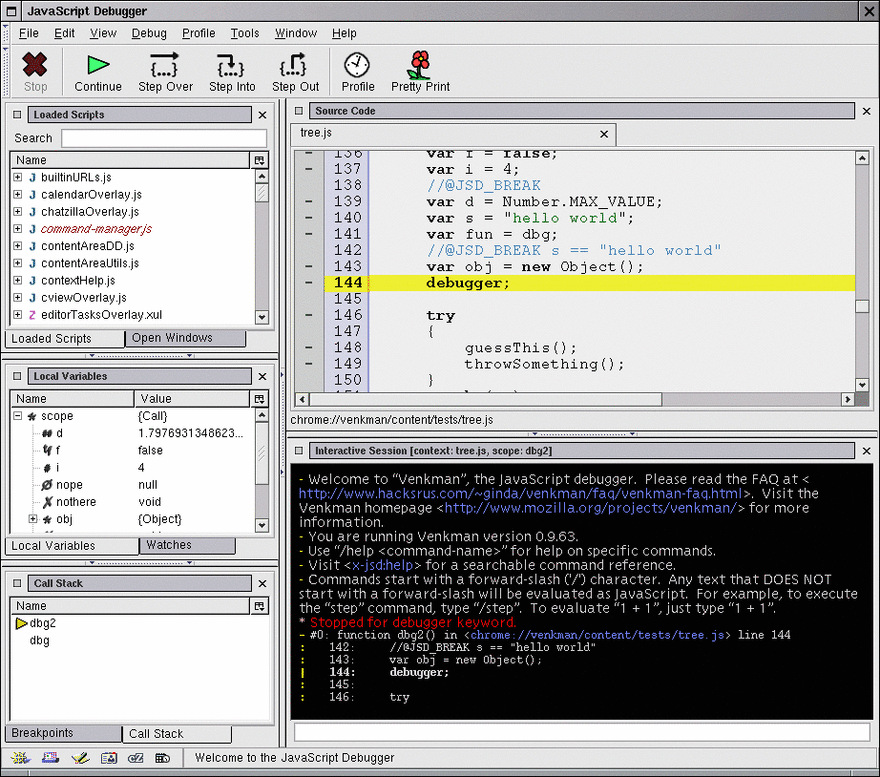
On the JavaScript side, you couldn’t, of course, output all of your logs to an alert window in a separate frame. Pretty soon, more complex software was released to bridge the gap. Among the most popular was Venkman, an extension for Firefox launched in 2002 that let users run JavaScript straight in the browser and log info and errors directly inside of it. Venkman came packed with advanced features, allowing you to step through your JavaScript code and pick it apart, debugging it little by little. Before long, a number of similar projects launched on every major browser.
In 2004, web practitioners began popularize a new way of thinking about the web. The Web, it was said, had been in read-only mode for over a decade. That was Web 1.0. The web was now entering a new phase: Web 2.0. A web come alive with interactivity and real-time applications.
Framing in the web in such a way was always a massive oversimplification, but as a marketing effort it largely worked. Within a year some of the earliest web applications, such as Gmail, were first launched. The term AJAX was coined to describe a more interactive use of the JavaScript language. Whether it was on its way already, or simply wished into being, a new web had certainly arrived. And a new web would need new tools.
These tools were being worked on. Throughout 2005, Firebug and Web Inspector were in active development and testing. When they were released in early 2006, they were more a product of the projects that had come before them than entirely new pieces of software. Their largest advantage was that they combined everything into a single package.
Both, for instance, came with a DOM inspector. Pop open Firebug or Web Inspector, hover over anything you want in the webpage, and be brought instantly to where they were in the HTML. It also featured a view of CSS styles. In the JavaScript console, developers could easily track info and errors in their code in a new tab.
Each tool had their strengths in the beginning. Firebug began as a JavaScript tool, and it’s console saw the most active development. It included tools specifically designed for AJAX, logging dynamic requests directly in the console. Hailed as a custom fit for Web 2.0 for a browser that had been ahead of the curve for years, Firebug gained traction quickly.
Web Inspector, on the other hand, put a greater focus on View Source derived tools. It let you easily view any CSS styles associated with the markup that you were looking at with simple tools for modifying them. It also had one handy feature developers would come to rely on. Hover over any part of a page, right click, and select “Inspect Element” and you that part of the webpage’s code would be instantly brought up in the DOM inspector. It was a simple shortcut, but one that made things infinitely easier.
Over time, the tools adopted techniques and features from one another. Web Inspector, as part of the Webkit project, was open source by default. By the end of 2006, after a few upgrades to the software, Hewitt decided to make Firebug open source as well. With a global community of developers, both tools grew quickly. Within a couple of years, they had become stable software with frequent new features and updates.
For developers experimenting with Web 2.0, they became the standard. Browsers largely have picked up the flag themselves, embedding these kinds of developers tools directly into the browser. And the web moved forward just a little more.


Top comments (0)