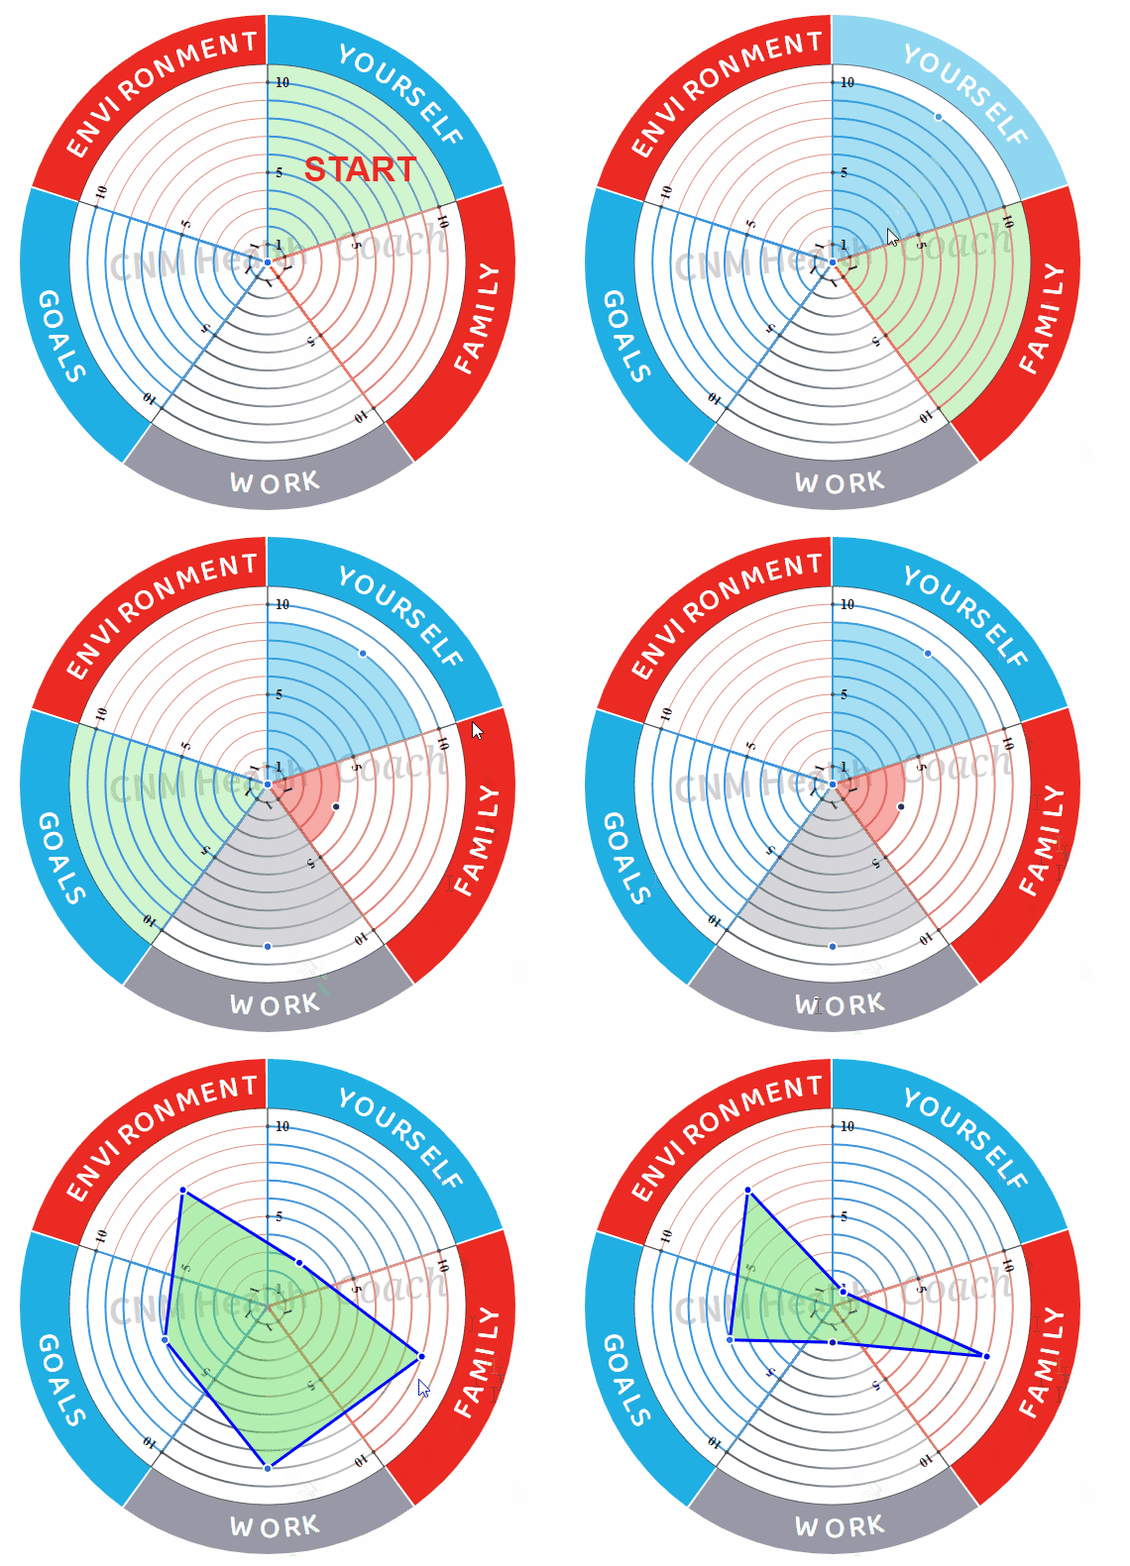
Draw Arc Lines
First of all, you need to draw Arcs to form up a circular chart.
There is a mathematical theory to draw polar points.
function polarToCartesian(centerX, centerY, radius, angleInDegrees) { // Point of Polar
  var angleInRadians = (angleInDegrees - 90) * Math.PI / 180.0;

  return {
    x: centerX + (radius * Math.cos(angleInRadians)) + setViewportX,
    y: centerY + (radius * Math.sin(angleInRadians)) + setViewportY
  };
}
Then draw the start and endpoints of the Arc with radius, call describeArc() method to finish drawing Arc.
function describeArc(x, y, radius, startAngle, endAngle) {
  var start = polarToCartesian(x, y, radius, endAngle);
  var end = polarToCartesian(x, y, radius, startAngle);

  var largeArcFlag = endAngle - startAngle <= 180 ? "0" : "1";

  var d = [
    "M", start.x, start.y,
    "A", radius, radius, 0, largeArcFlag, 0, end.x, end.y
  ].join(" ");

  return d;
}
The title of each section of the circle has an order - Clockwise and vice versa.
As a result, you need to define the flag for direction.


Top comments (0)