
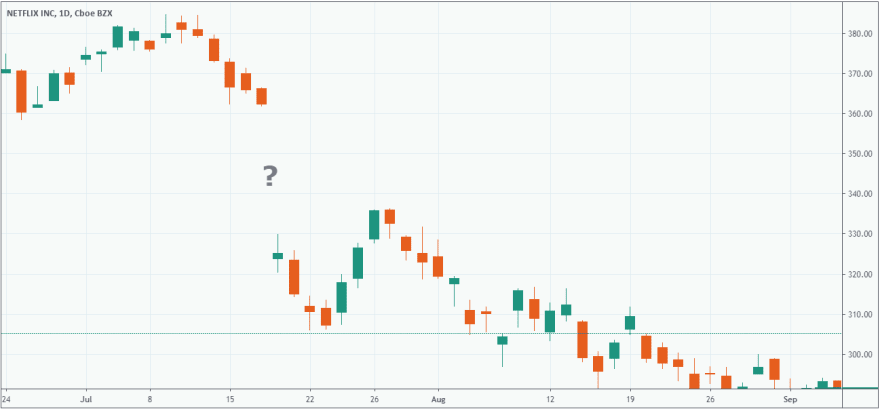
Anyone that has ever stared at a stock chart on their monitor in anticipation of the opening bell will know that stocks don’t open at the same price that they close. Most charting software doesn’t incorporate after-hours and pre-market price action, and therefore most charts look like this:
As soon as one starts diving further into the realm of extended-hours trading they start asking a lot of questions. Does a stock that is increasing in price during pre-market continue to increase during the day? Should I short Tesla if it has a bad earnings report? Will the S&P500 stay positive if it’s already increased in pre-market?
We can answer this by studying historical pricing data using Python. All the code from this post is available on Github.
Objectives
Let’s try to discover if pre-market prices have any predictive qualities. Is it possible to build a successful trading system using stock performance in extended-hours.
- How important is pre-market price action relative to intra-day performance?
- What is the probability that a select stock increasing in pre-market will also increase throughout the intraday session?
- What’s the probability that a stock trending in pre-market will continue to trend in the same direction during intraday trading?
- What effect does earnings season have, are pre-market trends following announcements stronger or weaker indicators of intraday prices?
Data Collection & Methodology
The goal is to examine whether pre-market movements are indicative of intraday price action, to what extent can price action inform our investment decisions. For this we will need to define certain conditions, determine which variables we will analyze, outline our methods, and ultimately build a program that will output some results.
Defining Pre-Market
Pre-market and after-hours trading are two sessions that occur before and after the main intraday session, respectively. Traditionally, we would look at these two sessions individually, because they are separated by an 8-hour “dead” period, where no trading occurs. Pre-market runs from 4:00 to 9:30, after-hours runs from 16:00 to 20:00, and between 20:00 and 4:00 there is no trading. Pre-market and after-hours are very similar, with the same market participants and liquidity profiles. They also both play host to earnings announcements during company reporting cycles, which means this is when most price-action will occur following an announcement.
Instead of examining what happens within these sessions on an individual level, we like to think of the pre-market holistically as the time between the day’s close, and the next day’s open; 16:00 – 9:30. Regardless as to whether the company reports in after-hours or pre-market, the intraday session always follows later. We will therefore be examining the pre-market holistically, and analyzing the reactionary price action in the following intraday session.
Data Collection
For data collection we used Ramaroussi’s Yahoo! Finance Python library, which allows us to fetch historical price data for individual stocks. We made the sample of stocks the S&P 500 and Nasdaq 100 constituents, which aren’t as thinly traded as Russel 3000 components.
def get_hist(symbol):
    target_tickers = []
    target_tickers.append(symbol)
    fetch = yf.download(tickers =
                target_tickers,
                period = "5y",
                interval = "1d",
                group_by = "ticker",
                auto_adjust = False,
                prepost = True,
                treads = True,
                proxy = None)
We used the historical data based for the trailing 5 years of each security. It is possible to complete this analysis without including pre-market and after-hours price data, by simply using the difference between the market open and the previous day’s close, so any EOD data source would be acceptable.
A component of this analysis considers the price action differences associated with reporting periods. À la post announcement drift, stocks tend to exhibit higher volatility and returns in the time leading up to and shortly following an earnings report. It was important that we find a data source that would allow us to quickly identify reporting periods within our five year sample period. For this we used the U.S. Securities and Exchange Commission’s EDGAR database. While the SEC offers a free API that can be used to fetch results, you can also scrape filings using Beautiful Soup 4, which is what we have done.
Juxtaposing the reporting dates over the 5 year performance allows us to analyze the price-action resulting from shifts in information crucial to understanding the price-discovery process. For the purpose of this study we ruled out companies that have IPOed in 2019, because of the small sample size.
Results
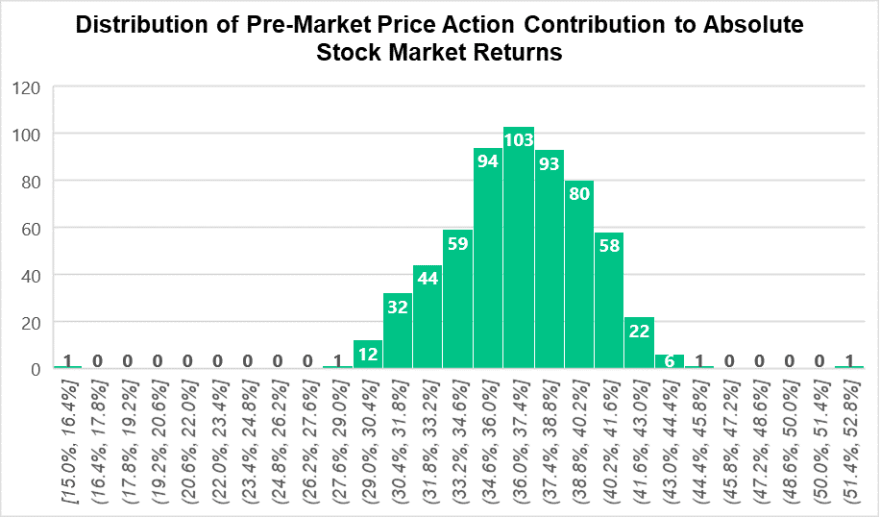
For the first test, we examine how much does pre-market activity contribute to total (close-to-close) price action.
Since we want to focus on the SP500 and Nasdaq 100 constituents we will initiate the first test by passing a list of symbols through the function.
stocks = qqq() + spy()

test_sample_contribution(stocks)
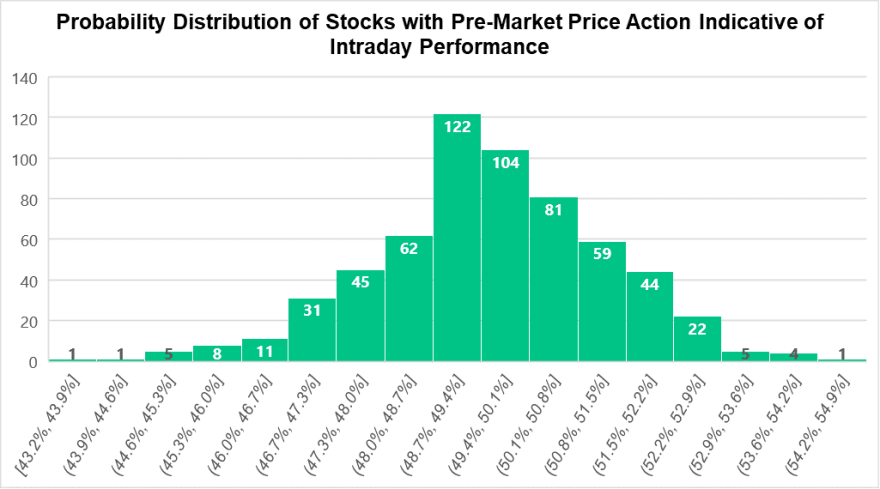
We find that on average pre-market trading contributes 36.68% to absolute daily price action in the sampled stocks.
The histogram below offers a visual representation of the attributable pre-market price action of the individual stocks. This clearly shows that a significant part of price movements occur outside of regular trading hours.

Moving further, we now aim to determine whether a stock that is increasing in value during pre-market will continue to increase through intraday. After all, this is the determining factor in whether you should buy a stock that has popped overnight.
We use the function below and pass the SP500 and Nasdaq stocks as arguments in a list.
test_sample_long(stocks)
We find that on an aggregate level, a stock increasing in value during pre-market has a 50.77% probability of maintaining it’s price action during through the regular session. This is interesting because it suggests that there is close to no correlation, and the odds that stock will continue to increase are as good as flipping a coin. Some would argue that this is a great testament to the efficiency of a market in that this showcases an anti-persistent property.
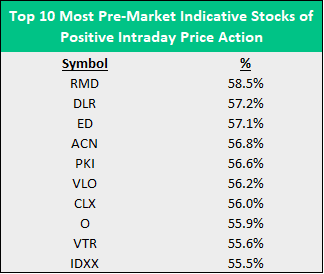
With that said, there are still stocks that lend themselves to more predictability, as presented below.
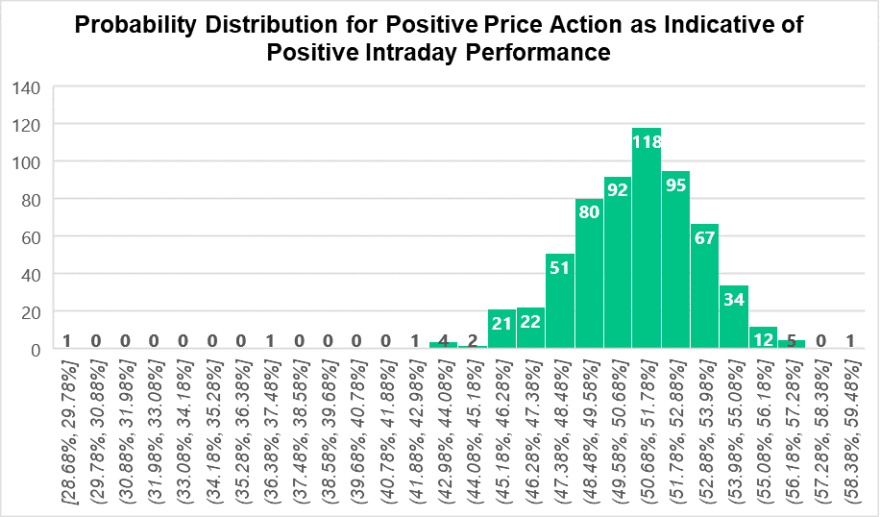
The previous test took into account only positive price action, and now we must test whether pre-market price action is at all indicative of intraday performance. This means we want to consider events where the pre-market action and intraday performance were both either positive or both negative. Similar to how investors use fair-value trading strategies with pre-market futures.
We apply the next function, passing the same sample of stocks as an argument.
test_sample_indication(stocks)
We find that a pre-market activity is indicative of intraday performance 49.65% of the time. Which means that it is actually statistically more likely for the market to do the opposite of what it’s done in pre-market.

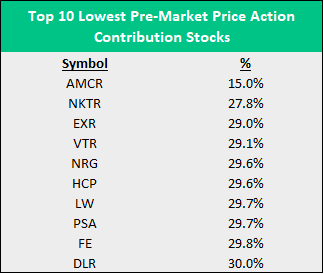
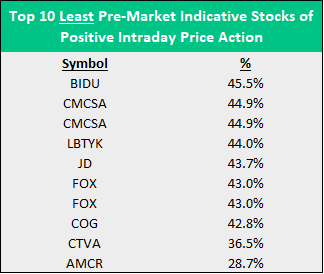
This doesn’t leave us with any actionable results. Examining individual markets shows little deviation from the mean, and there are few stocks that show any indicative behavior in pre-market.
Surely, there must be time when stocks move in a more predictable way with respect to pre-market. In the final test, we aim to run through the same statistics, but we will change the sample to include only the reactionary period that follows the quarterly reporting period.
test_sample_earnings(stocks)
Using the function above we will now scrape the EDGAR database for reporting dates, and pull historical returns from the following trading day.
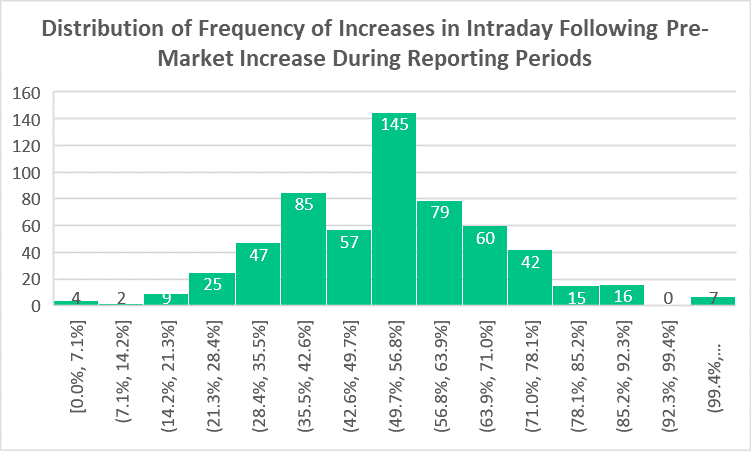
S&P500 & Nasdaq 100 stocks increase in both pre-market and intraday, following an earnings announcement, 27.10% of the time.
Out of the four possibilities of price action between the pre-market and intraday session, 27% is in line with our expectations, given the previous results we have seen. We expect to see more correlation during reporting periods because of event’s significance warranting more investor attention. Therefore, it can be inferred that under the pressure of higher trading volume there would be more momentum in price-action, causing prices to move in the same direction.

There is a noticeably higher dispersion in the data following this test. It is important to remember that for certain stocks the number of reporting periods is less because the companies are newer to the exchange, and this plays a large role in constraining the sample.
Below we can see the top and bottom ten stocks by frequency of increases in both pre-market and intraday. A high frequency not only demonstrates that the company has performed better in the sessions following previous reports, but there is an inherent price-action consistency, and we can expect more causal attribution in further tests.
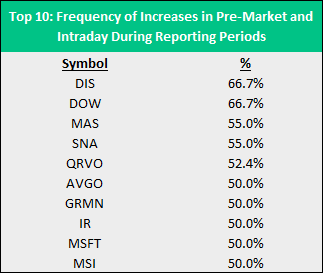

The probability of a stock increasing throughout the intraday, after having increased in pre-market is 52.4%.
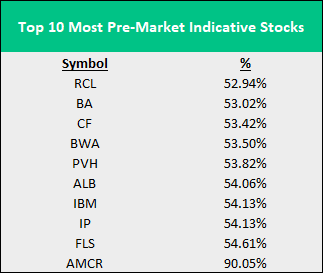
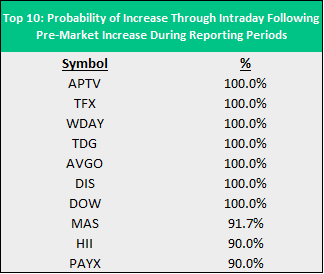
Similarly to the 5 year aggregate test, we see a close to fair result in whether pre-market price action is indicative of intraday action. However, like with the previous test, there is a higher dispersion, and we are able to identify companies that lend themselves to significantly more predictability.
In the case below we are presented with 7 companies that have shown to have a perfectly indicative pre-market price action. In other words, if Broadcom Inc. (AVGO) or Disney Inc. (DIS) reports earnings and increase in pre-market, they are going to increase intraday as well.
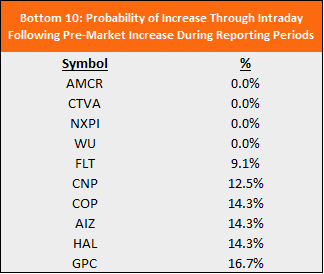
Conversely, anytime Corteva Inc. posts earnings and increases in value in the pre-market, you would be better off shorting it.
Final Remarks
In testing whether pre-market action is indicative of intraday performance we can conclude several things.
- Pre-market price action plays a significant role in all sampled stocks and should not be ignored.
- On an aggregate level pre-market price action does not dictate intraday price action.
- Select stocks have shown historically to have a more indicative pre-market price action.
- During reporting periods stocks move with more volatility, however pre-market price action is only slightly more indicative than on a five-year historical level.
- In the case of select stocks, reporting periods can bring out indicative pre-market behavior.
- Specific stocks should be tested for larger time periods in order to assess the true predictability of pre-market price action, however some companies are too young to have enough reporting periods to analyze.
Keep in mind that these tests are subject to misinterpretation and price action may still be driven by unique fundamentals within the stocks that exhibited highly-indicative pre-market behavior. Additionally, past returns can be useful in approximating future price action, but do not guarantee future performance. Finally, remember that the market changes constantly, and strategies that work today may not work tomorrow, however using the takeaways from these methods of pre-market analysis can help drive better decision making.

Top comments (0)