
Hello! In this post, I'd like to address an issue of the load testing. One of the best tools available is Apache JMeter. It is free, open-source and, thanks to its Java nature, cross-platform. Although, it has a bit strange interface, so this article serves also as a quickstart to JMeter. In this post, we'd observe what is a load testing and how it is different from performance testing; how JMeter works and how to compose your tests; and finally - we would test a very simple server, written with plain Vert.x.
What is a load testing?
Before we would start with load tests, let quickly point out what is a load testing itself. First thing first, we should remember, that load testing is a non-functional testing: it refers to aspects of the software that may not be related to a specific function or user action. We use load testing in order to study app's behaviour under a specific load. We need to distinguish load testing and performance testing. We use performance testing to analyze overall app's performance under a heavy load.
Introduction to JMeter
In this section we would quickstart with Apache JMeter. I assume, that you already have it installed on your machine. If you don't have it, you can download it on Apache Foundation website. But keep in mind, that it requires at least Java 8 to run.
Getting started with JMeter
For start, let just quickly observe JMeter's interface. When you run it, you would see a similar window as on the screenshot below:
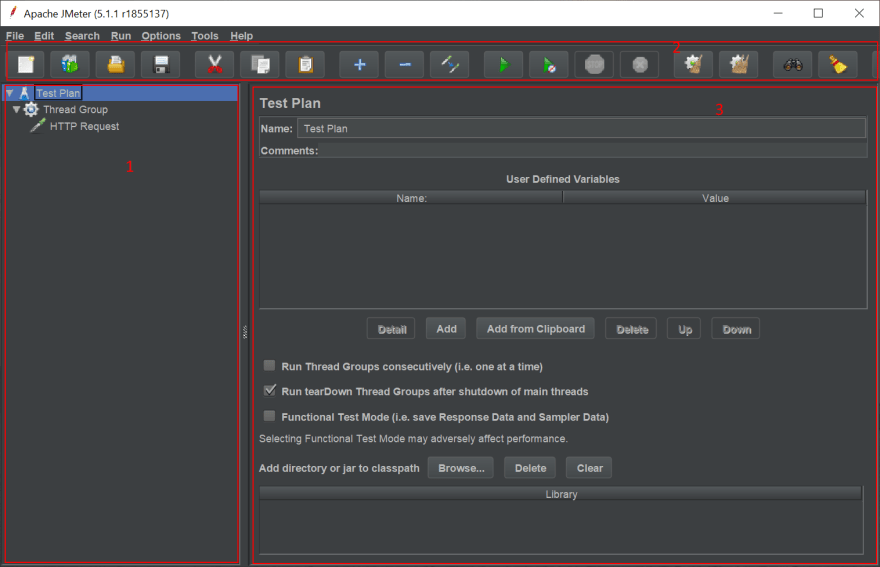
I've divied the JMeter window on 3 areas:
- Test plan area = this is a tree-based structure, where you can manage your test's structure, add/remove items (see next about them)
- Toolbar = this bar contains most important actions, applied to the test - save/open a saved test, run, etc.
- Element area = in this part you can configure an individual item (thread group, elements etc.)
Now, let see what JMeter offers to us in terms of test plan structure.
Test plan structure
JMeter operates its own terminology, that you should be familiar with. One of key concepts here is a test plan. Test plan is a root structure of load tests and represents what to test and how to go about it. It can include thread groups, that control the number of threads JMeter will use during the test. Thread groups include different elements, for example samplers (used to send requests to server; for example HTTP or FTP requests), logic controllers (to define logical conditions; if/for etc.), listeners (used to visualize tests output in the form of tables, graphs, trees, or simple text in some log files). These elements are most used, but not only ones. There also others, like assertions, configuration elements, timers etc., that you can use in your tests. Also, it is worth to remember an execution order of test plan elements:
- Configuration elements
- Pre-Processors
- Timers
- Sampler
- Post-Processors (unless SampleResult is null)
- Assertions (unless SampleResult is null)
- Listeners (unless SampleResult is null)
You can find a more detailed description of test plan elements in this Tutorialspoint tutorial. In my turn, I would not waste your time - so let move directly to the example API.
Example API
Writing a REST API is not a subject of this post, so we will use a very simple API. For this example, we even would not use any external dependencies - Vert.x Core package is more than enough. We just need to have a dummy endpoint, nothing more. Add this code:
public class DummyService extends AbstractVerticle {

    private long start;

    @Override
    public void start() throws Exception {
        HttpServer server = vertx.createHttpServer();
        start = System.currentTimeMillis();
        server.requestHandler(req->{
            long stop = System.currentTimeMillis();
            long duration = stop - start;
            req.response().end("Service is running "+duration+" ms");
        });
        server.listen(8800, "localhost");
    }

    public static void main(String[] args) {
        Vertx vertx = Vertx.vertx();
        vertx.deployVerticle(new DummyService());
    }

}
Run this and access in your browser, to check that everything is up and running:

Now, we have a dummy endpoint, let write a simple load test with Apache JMeter.
How to do load testing with JMeter?
In this section we would create a simple load test with Apache JMeter. You should perform following steps:
Step 1. Create new Thread Group

To start load testing, we need create new thread group. Right-click on Test Plan and select Add > Threads (Users) > Thread Group. Here we can specify following parameters:
- Number of threads = 10
- Ramp-Up period = 1
- Loop count = 100
Step 2. Set up configuration
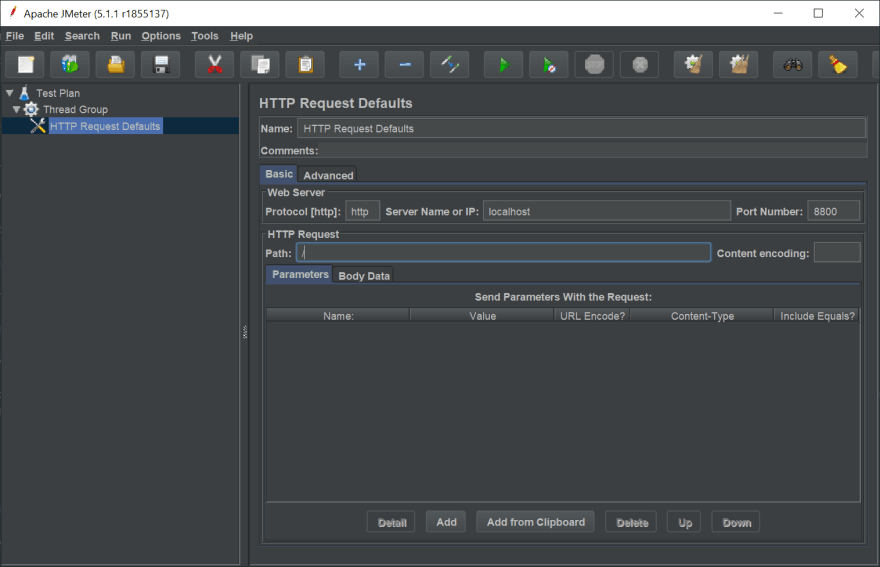
Next step is to set up config for our load test. Our dummy api is running as localhost:8800, therefore we should tell JMeter where to find it. Right click on Thread Group and select Add > Config Element > Http Request Default. Here we add:
- Protocol = http
- Server name = localhost
- Port = 8800
- Path = /
Step 3. Add HTTP Request
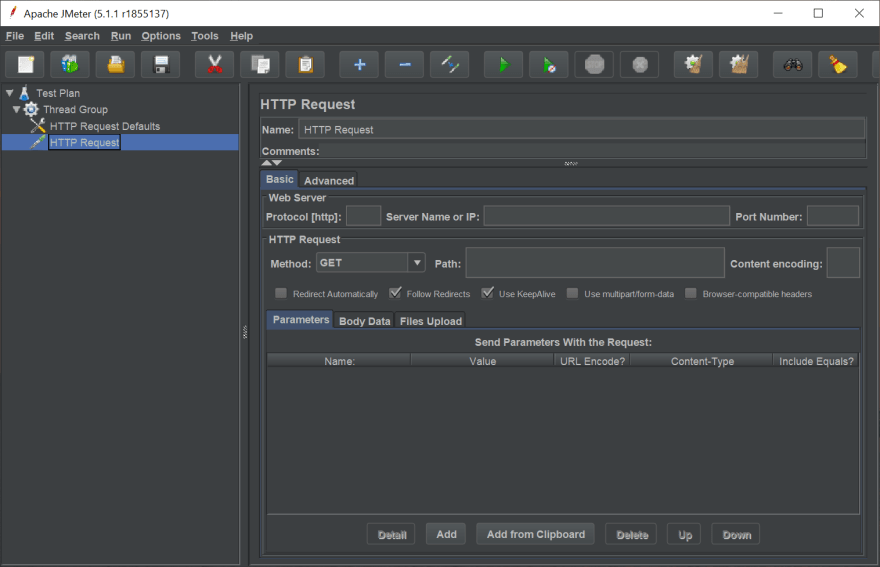
We can now add a sampler - in our case HTTP Request. We predefined everything in the previous step, so nothing to add here. Although, in more complex tests, of course you have to specify it. Leave everything blank for now.
Step 4. Create a listener

Finally, add a listener - an element to show results. Go and add Add > Listener > Summary Report. The summary report creates a table row for each differently named request in your test. With this component, you also can save data as CSV.
Step 5. Run a test

And now, you can run a load test (NB don't forget to save the test). We received a data table, that we can interpret:
- Label = name of the HTTP Request sampler
- Samples = number of virtual users per request
- Average = average time taken by all the samples to execute specific label
- Min = the shortest time taken by a sample for specific label.
- Max = the longest time taken by a sample for specific label
- St.Dev = a set of exceptional cases which were deviating from the average value of sample response time.
- Error = a percentage of Failed requests per Label.
- Throughtput = a number of request that are processed per time unit(seconds, minutes, hours) by the server
I recommend you to observe the documentation for summary report or this post on understanding a summary report.
Conclusion
In this post we observed load testing of Java web applications. One of the best tools available for this is Apache JMeter. It is free, open-source and, thanks to its Java nature, cross-platform. In this post, we have checked what is a load testing and how it is different from performance testing; how JMeter works and how to compose your tests; and finally - we tested a very simple server, written with plain Vert.x Core.
References
- Bernhard Knasmüller. How to Use JMeter to Performance Test a REST API (2019), read here
- Mutiara Hana. Performance Testing with JMeter for Dummies (2018), Medium, read here
- Ragnar Lonn. When should I start load testing?, TechBeacon, read here
- Rishil Bhatt. Understand and Analyze Summary Report in Jmeter (2017), read here


Top comments (0)