
Have you ever desired to watch your code running, instead of just imagining it?
Hi, I'm Valerio software engineer from Italy and CTO at Inspector.
As product owner I learned on my skin how an application issue can be so hard to fix, creating a negative impact on the users experience, or block new potential customers during on-boarding.
I publish new code changes almost every day and unfortunately it's quite impossible to anticipate all the problems that could happen after every release. Furthermore users don't spend their time to report bugs, they just stop using our application, checking for another one that fits their needs better.
In most of the projects I've worked on the 50% of the drawbacks for users were caused by simple code mistakes, but the more the application grows the more difficult it is to avoid these incidents.
When I started to share my idea behind Inspector I realized that many developers know the problem: they spend a lot of time to investigate strange behaviors inside their application, but they didn't know that there's a solution to eliminate this complexity in two minutes, avoiding customer complaints or even the loss of the customer.
Be the first to know if my application is in trouble "before" users stumble onto the problem, drastically reduce the negative impact on their experience, giving me the right foundation to run a successful users acquisition process and to continually increase engagement with less interruptions as possible.
Inspector is an npm module to add real-time code execution monitoring to your NodeJS application, allowing you to work on continuous code changes while catching bugs and bottlenecks at a glance before users do.
In this article I'll use Express framework to build code snippets, but you are free to use Inspector in any Nodejs script.
NodeJS Code Execution Monitoring: how it works
It takes less than one minute to get started. Let me show you how it works.
Install Inspector
Run the npm command below in your terminal:
npm install @inspector-apm/inspector-nodejs --save
Configure the Ingestion Key
Get a fresh Ingestion key by signing up for Inspector and create a new project, it takes just a few seconds.
You'll see installation instructions directly in the app screen:
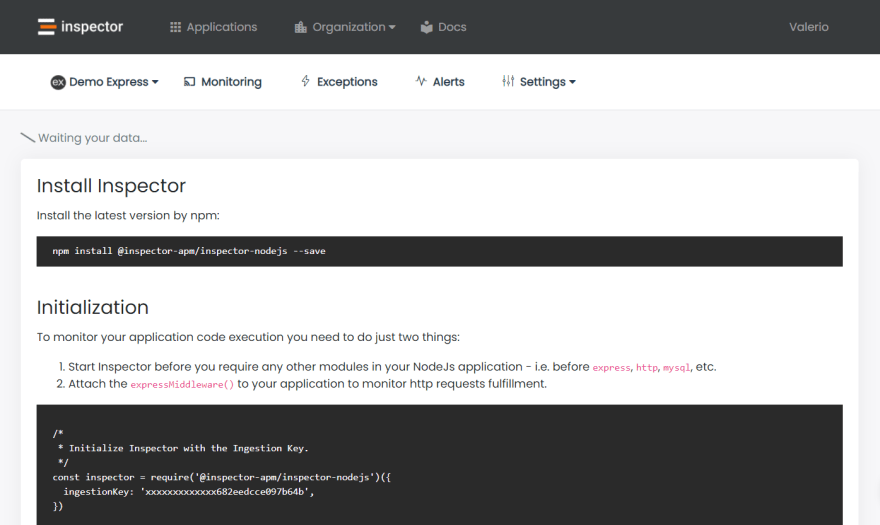
Initialization
To monitor the code execution in real time you need to do just two steps:
- Initialize Inspector before you require any other modules in your application – i.e. before
express,http,mysql, etc. - Attach the
expressMiddleware()to your express app.
/* -------------------------------------------
 * Initialize Inspector with the Ingestion Key.
 --------------------------------------------- */
const inspector = require('@inspector-apm/inspector-nodejs')({
  ingestionKey: 'xxxxxxxxxxxxx',
})

const app = require('express')()

/* -----------------------------------------------
 * Attach the middleware to monitor HTTP requests fulfillment.
 ------------------------------------------------- */
app.use(inspector.expressMiddleware())

app.get('/', function (req, res) {
    inspector.reportException(new Error('My first Error!'));
    return res.send('Home Page!')
})

app.get('/posts/:id', function (req, res) {
That's it.
Navigate your application
Now when your application receive a request Inspector automatically detect the most important events and create a visual representation of what happens inside your code during its normal operation to keep an eye on the behavior in execution.
Launch the app with node app.js command, and navigate it in the browser on http://localhost:3006.
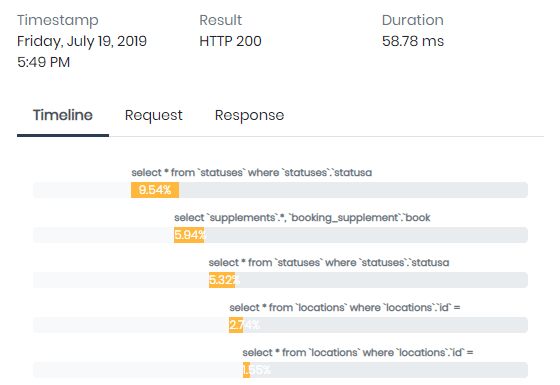
Instantly you will see transaction streams in your dashboard and for each transaction you can monitor what your application is executing in real-time:
Enrich your timeline
Inspector monitors database query, with many type of driver (mysql2, postgre, mongodb) by default, but there might be many critical statements in your code that needs to be monitored in terms of performance and errors:
- Algorithms
- Function that deals with files (pdf, excel, images)
Thanks to our module you can add custom segments in your timeline in addition to those detected by default, to measure the impact that an hidden code block has on a transaction’s performance.
Let me show you a real life example.
Suppose you have a function that export data from the database in a csv file.
app.get('/export', function (req, res) {
    connection.query(
        'SELECT * FROM users',
        function (err, results, fields) {
           res.download(
               ExportService.createCsv(results)
           )
        }
    )
})
The query will be automatically detected by Inspector but it could be interesting to monitor and measure the execution of the exprot function and activate alerting if somethings goes wrong. Here you can create a custom segment to add the file export statement in your timeline and monitor its impact on the request fulfillment over time.
app.get('/export', function (req, res) {
    connection.query(
        'SELECT * FROM users',
        function (err, results, fields) {

           // Add the export procedure to the timeline
           inspector.addSegment(() => {
              return ExportService.createCsv(results)
           }, 'export').then(file => {
              res.download(file)
           })

        }
    )
})
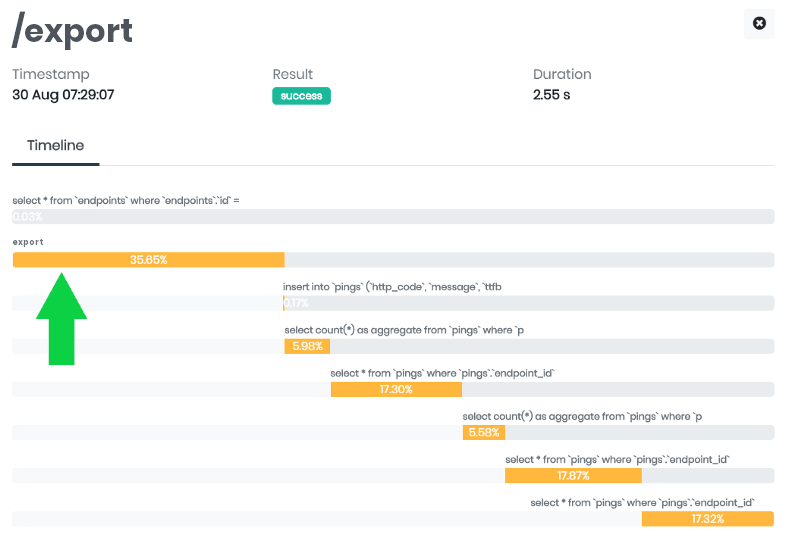
You will easily identify the impact of the new segment in the transaction timeline:
Errors & Exceptions Alerting
By default, every exception fired in your Nodejs app will be reported automatically to be sure you’re alerted for unpredictable errors in real time.
I wish that every change I make to my code could be perfect. But the reality is, this is not always the case. Some errors appear immediately after an update, while others pop up unpredictably. It's an unfortunate fact of life for developers which often also depends on problems caused by the connection between our application and other services.
However, Inspector makes the job easier. It automates the detection of unknown issues so I no longer need to manually check the status of my apps continuously or wait reports directly from users. If something goes wrong It will send a notification in real time, and after each release I can stay informed about the impact of the latest code refactor.
If your code fires an exception but you don't want to block the execution, you can report the error to inspector manually for personal monitoring.
try {

    // Your dangerous external call here...

} catch (e) {
   inspector.reportException(e)
}
Furthermore, if the export method fails, you will be alerted in real time in your inbox to take a look at the error as it appears.

You even get access to detailed information gathered by Inspector in real time:

Conclusion
When a customer reports to you that something isn't working, it forces you to drop whatever you are doing and start trying to reproduce the scenario, then recapture and reanalyze the logs in your own toolset.
Getting a true picture of what's happening can require hours or, based on my experience, even days. Inspector can make a huge difference in terms of efficiency, productivity and customers happiness.
By delegating bug discovery to an automatic NodeJs monitoring tool, it makes 90% of the work behind the scene, and you can solve issues before users even know about them.


Top comments (0)