
As part of my role as a web performance consultant, I constantly need to test two (or more) versions of a website and compare the resultant performance. Since performance isn't a single clearly defined metric and is comprised of a host of other metrics, each measuring different aspects of the loading experience, including page load, start render, LCP (largest contenful paint), FCP (first contentful paint), FID (first input delay), CLS (cumulative layout shift)...etc; very often the tests don't have a clear and absolute winner, "This is the fastest!"
This is not a unique problem to the website I am working on. As your users are likely to be distributed over a wide range of devices & varying network conditions, what might improve the performance for one user may degrade it for another. There are other factors too, for example some websites may have a larger segment of users visiting the website in Incognito or Private Browsing. Ultimately, to get the most accurate picture of your users' experience, you should make use of RUM (Real User Metrics). If your website receives enough visitors, you can access this data on Chrome UX Report. If not, you would need to collect this data yourself using tools such as SpeedCurve (paid) or Google Analytics.
This does not discard the importance of lab tests and very often, well-prepared tests can give a good indication of the expected behaviour for real-users once the changes are deployed to the production environment. On occassion, I also need to re-evaluate some decisions which were taken weeks or months earlier; sometimes due to the evolution of business requirements but more commonly due to changes to the website's code (ex: shipping more JavaScript, less images...etc). I therefore felt the need to create a reference which helps address my two needs:
- Remind me how each test compares to another.
- Helps me explain why one solution was preferred over another and why the preferred solution may have or have not changed.
Loading CSS
I created a GitHub repository where I will be adding different test cases together with sample code & test results from WebPageTest. Please feel free to contribute & leave feedback. The repository is also deployed on kevinfarrugia.github.io/performance-test-results-cheatsheet
Initially I only have a number of test cases where I compare the performance of different strategies to load CSS assets.
- Inline CSS - Instead of only inlining the critical CSS, all the webpage's CSS is combined into a single CSS file of 22.0KB. Consequently, there are no requests for external CSS files.
- Render-blocking CSS - Possibly the most "old school" way of loading CSS from the test cases. The CSS is combined into a single 22.0KB file and downloaded using an ordinary
<link rel="stylesheet" type="text/css" href="main.css" />placed inside the<head> - Inline critical CSS - Only 1.4KB of critical CSS (used above-the-fold) is inlined inside the
<head>while the remaining 21.4KB of CSS (bottom.css) is downloaded asynchronously using the media="print" trick. The remaining CSS also contains some minor styling which marginally impacts the view above the fold. - Inline critical CSS & preload - Similarly to above, except the remaining 21.4KB of CSS are preloaded using the resource hint
<link rel="preload" href="bottom.css" as="style" /> - preload to render-blocking CSS - Similarly to the render-blocking test case above, except the CSS file
main.cssis preloaded using<link rel="preload" href="main.css" as="style" />
Test Results
All tests were done using the Moto G4 - Chrome - 3G Fast browser preset on WPT. You may follow this link to access the data behind the test results described below.
As seen in the video above, the first pages to show any content are the inline-critical-css and inline-css and as a result they are the quickest to Start Render.
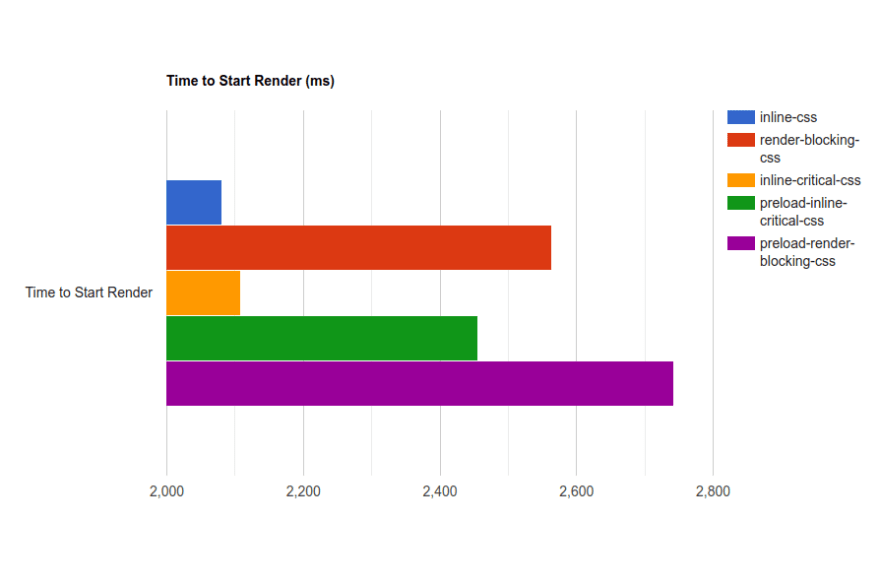
Interestingly, the page which inlines all the webpage's CSS still performs at-par with the one which only inlines the critical CSS, even if it needs to download more HTML (24.6KB). It is recommended to keep the initial HTML file under 14KB because of TCP's slow start, however we do not see that as holding true for our tests. 🤷
The next page to start rendering content to screen is the preload-inline-critical-css, slightly behind the equivalent without preloading bottom.css. Taking a look at the waterfall, it is clear that the cause for this delay is the preloaded file taking priority over critical resources, in this case the JavaScript file critical.js.
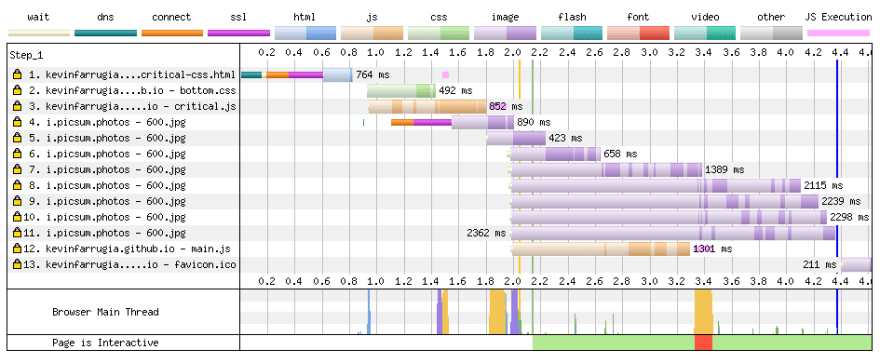
In the meantime, the first page with all CSS inlined has downloaded the image and is visually complete. A few milliseconds later, render-blocking-css paints to the screen for the first and last time. Therefore, when compared to inlining CSS (critical or all), it takes significantly longer to begin painting to screen and as a result the user is unaware if the page is loading and cannot see any content until all HTML & CSS is downloaded & parsed (images may still load afterwards).
The identical same results are observed for the preload-render-blocking-css page because the CSS file is already located in the head and treated with HIGHEST priority, therefore preloading it will not give you and performance improvements. In the video, it is coincidentally slightly slower because of a slower TTFB of the server; which is unrelated to the test itself. Successive tests registered identical results as without the preload hint.
And finally the inline-critical-css page is visually complete once the bottom.css is downloaded and applied. As a result, this page is the one which incurs the largest (albeit not significant) layout shift and scores the highest (lower is better) score for CLS.
Conclusion
I hope you found these tests interesting and perhaps learnt something new. Personally I always like to test any hypothesis, even if it is something that I have been doing almost instinctively and then use the test results to understand why the page is faster or slower. Feel free to get in touch if you would like to contribute or suggest new tests, have feedback on the above or anything else web performance related really. Thank you for reading and stay safe.


Top comments (0)