Graph Data Structure Introduction including: adjacency list, adjacency matrix and the incidence matrix.
what is a graph ?
The graph data structure is not the same as a graph you may have learned about a math class, graphs are collections of things and the relationships or connections between them. 
The data in a graph are called nodes or vertices the connections between the nodes are called edges.

one example of graphs is a social network, where the nodes are you and other people and the edges are whether two people are friend with each other.
Types of Graphs
Directed:
directed graphs are graphs with a direction and its edges.
example of a directed graph could be the internet and web page links the nodes are web pages and the directed edges are links to other pages.

-
Undirected Graph:
undirected graphs are graphs without any direction on the edges between nodes. example of an undirected graph could be a social network the nodes are people and the edges are friendships.

Graph Representation
Graph representation is a technique to store graph into the memory of computer. To represent a graph, we just need the set of vertices, and for each vertex the neighbors of the vertex (vertices which is directly connected to it by an edge).
the main representations of a graph is
- Adjacency List:
This representation for a graph associates each vertex in the graph with the collection of its neighboring vertices or edges.
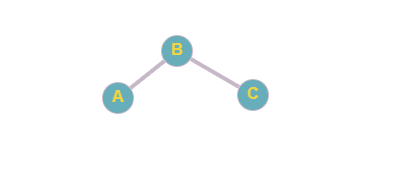
in this image A is connected to B, B is connected to A and C, and C is connected to B.
you could show the previous relationship with text as follows:
Node1: Node2, Node3
Node2: Node1
Node3: Node3
and the JSON list representation for the previous relationship would be:
var underictedG = {
  Node1: ["Node2", "Node3"],
  Node2: ["Node1"],
  Node3: ["Node3"]
}
and it's considered a un-directed graph because it's not showing the direction of the edges.
- Adjacency Matrix:
adjacency matrix is a two-dimensional array where each nested array has the same number of elements as the outer array so it's basically a matrix of numbers where the numbers represent the edges zeroes means there is no edge or relationship and one means there is a relationship.
| A | B | C | |
|---|---|---|---|
| A | 0 | 1 | 0 |
| B | 1 | 0 | 1 |
| C | 0 | 1 | 0 |
this table shows an adjacency matrix, you can see that the labels for the nodes are on the top and left.
then, the JavaScript representation of the same thing is like this:
let adjMatrix = [
  [0, 1, 1],
  [0, 0, 0],
  [1, 0, 0],
]
unlike an adjacency list each row of the matrix has to have the same number of elements as nodes in the graph here we have a 3 by 3 matrix which means we have 3 nodes our graph
Adjacency matrix can be used to represent a directed graph here's
a graph where the second node has an edge pointing toward the first node and then the third node has an edge pointing to the first node.

the numbers in the array will change, there are only ones where a node is pointing toward another node and since there are only two points there are only two nodes.
let adjMatrix = [
  [0, 0, 0],
  [1, 0, 0],
  [0, 1, 0],
]
- Incidence Matrix
Like the adjacency matrix, incidence matrix is a two-dimensional array however the rows and columns means something else here.
the adjacency matrix use both rows and columns to represent nodes and incidence matrix uses rows and columns to represent nodes and the columns to represent edges. this means that we can have an uneven number of rows and columns.
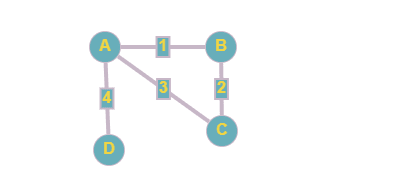
each column will represent a unique edge also each edge connects two nodes to show that there is edge between two nodes. you will put a 1 in the two rows of a particular column as you can see in the diagram.
edge 1 is connected to nodes A and B now look at the column for edge 1 in the incidence matrix table you will see a 1 in both the A row and the B row. this shows the edge 1 connects the nodes A
and B.
and that's what you need to know about graphs in JavaScript, see in next blog.


Top comments (0)