In my previous post Azure DevOps build pipeline for ASP.NET Core I've described essential steps that any build pipeline should consist of. For the reference, those steps are:
- Getting a code from source control.
- Building projects.
- Executing unit tests
- Performing code quality analysis
- Producing a deployable artifact
Continuous Integration pipeline for Angular application is no different, but there are some quirks that require special consideration. This post is intended to be a straightforward recipe to creation of such pipeline in Azure DevOps, leading to the working build in a shortest amount of time. One assumption is that your Angular project is called "AngularApp" and located under the "src" folder of Git repository. Without further ado let's see how to do that in Azure DevOps.
Restore project dependencies
- task: Npm@1
  displayName: 'Install Dependencies'
  inputs:
    command: 'install'
    workingDir: 'src/AngularApp'
Build Angular project
- task: Npm@1
  displayName: 'Build Angular'
  inputs:
    command: 'custom'
    workingDir: 'src/AngularApp'
    customCommand: 'run build -- --prod'
Publish Artifact
In Angular pipeline we can publish artifact first, and we can do testing and analysis later.
- task: PublishPipelineArtifact@0
  inputs:
    artifactName: 'angular'
    targetPath: 'src/AngularApp/dist'
Prepare for unit testing
To run tests in the CI pipeline some changes are required in "karma.conf.js" configuration file. For example, we do not want a Chrome window popup to appear in unattended execution. However if we make those changes directly then it will interfere with our local testing. Therefore I choose to create a copy of "karma.conf.js" and rename it as "karma.conf.ci.js" so we can modify it freely.
We need to define puppeteer executable in module.exports:
const puppeteer = require('puppeteer');

 process.env.CHROME_BIN = puppeteer.executablePath();
In the plugins array we need to add a unit test reporter:
require('karma-junit-reporter')
To the reports we will add "cobertura":
reports: ['html', 'lcovonly', 'text-summary', 'cobertura'],
To the reporters we'll add a junit configuration:
reporters: ['progress', 'kjhtml', 'junit'],

    junitReporter: {

      outputDir: '../junit'

    },
Finally, we disable Chrome popup and enable singleRun flag:
browsers: ['ChromeHeadless'],

    singleRun: true
Now we are ready for the next step.
Run unit tests and code coverage analysis
You can do it in one step.
- task: Npm@1
  displayName: 'Test Angular'
  inputs:
    command: 'custom'
    customCommand: 'run test -- --watch=false --code-coverage --karmaConfig src/karma.conf.ci.js'
    workingDir: 'src/AngularApp'
Publish testing and code coverage results
Those are split into two steps so they can be displayed on Azure DevOps dashboard separately
- task: PublishTestResults@2
  displayName: 'Publish Angular test results'
  condition: succeededOrFailed()
  inputs:
    searchFolder: $(System.DefaultWorkingDirectory)/src/AngularApp/junit
    testRunTitle: Angular
    testResultsFormat: JUnit
    testResultsFiles: "**/TESTS*.xml"

- task: PublishCodeCoverageResults@1
  displayName: 'Publish code coverage Angular results'
  condition: succeededOrFailed()
  inputs:
    codeCoverageTool: Cobertura
    summaryFileLocation: '$(System.DefaultWorkingDirectory)/src/AngularApp/coverage/cobertura-coverage.xml'
    reportDirectory: '$(System.DefaultWorkingDirectory)/src/AngularApp/coverage'
    failIfCoverageEmpty: false
That's how test dashboard looks in Azure Devops after pipeline execution:

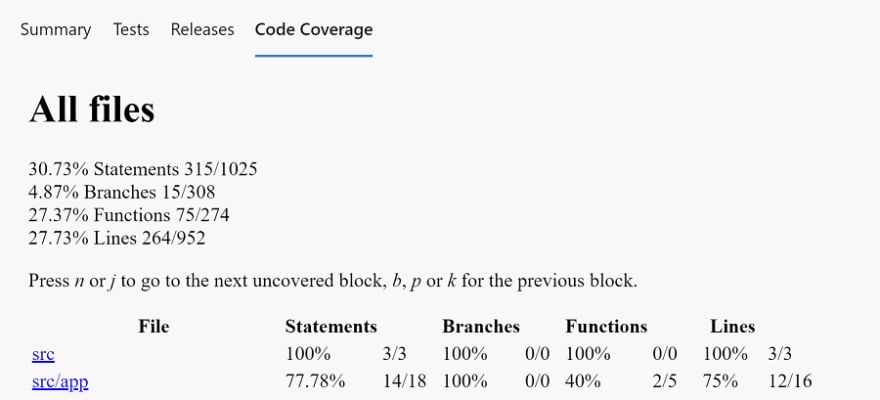
And code coverage tab example:

Here is a full pipeline code for your reference:
Thank you, I hope that was useful. Here is a corner (angular:) cat for you!

Photo by Sebastian Molina fotografía on Unsplash
Business vector created by macrovector - www.freepik.com


Top comments (0)