
Intelligent Medical Objects (IMO) and its clinical interface terminology form the foundation healthcare enterprises need, including effective management of Electronic Health Record (EMR) problem lists and accurate documentation. Over 4,500 hospitals and 500,000 physicians use IMO products on a daily basis.
With Honeycomb, the engineering team at IMO was able to find hidden architectural issues that were previously obscured in their logs. By introducing tracing into their .NET application stack in AWS, they were able to generate new insights that unlocked reliability and efficiency gains.
Michael Ericksen, Sr. Staff Software Engineer at IMO, contributed this guest blog detailing the journey.
At IMO, our 2019 engineering roadmap included moving application hosting from multiple data centers into AWS. The primary hosting pattern to migrate was a .NET application running on a Windows instance behind a load balancer. In AWS, we use SSM documents written in PowerShell to define the steps to install agents, configure IIS, and perform other machine configuration prior to installing application code. We compose these discrete documents into orchestration documents (more than 25 in total) that execute upon instance launch based on the tags associated with the instance.
Uncovering issues with trace instrumentation
Our production applications have predictable load distribution during core business hours. We don’t see traffic spikes that demand instantaneous scaling. Development teams use scheduled Auto Scaling Group actions in our pre-production accounts to toggle capacity after business hours, generating significantly more activity. After a year of reliable operation under lower load parameters, we started hearing reports from internal users that the provisioning service in these pre-prod accounts was intermittently failing.
However, we didn’t have an easy toolset and vocabulary for describing our service reliability. We had logs! Unstructured ones. Lots of them.
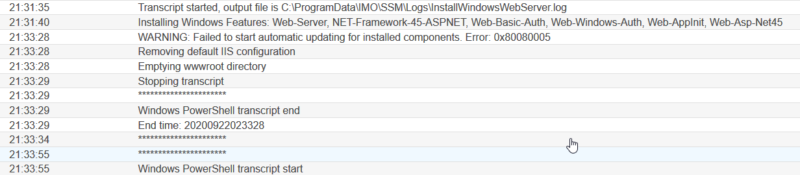 Default log output generated during SSM provisioning
Debugging issues for end-users meant searching through the copious logs generated by our processes. A dashboard aggregated the number of errors that appeared in the log files. That visibility helped us stabilize the service, but it didn’t provide critical insights to improve service operation for users.
I had used the Honeycomb agentless CloudWatch integration to ingest structured logs from Lambda functions. I was optimistic I could adopt a similar pattern to provide visibility into our provisioning process. The germ of the idea was simple:
- Write structured logs to stdout
- Ingest them via CloudWatch
- Forward them to Honeycomb using the agentless CloudWatch integration
One key technical difference between a Lambda function and SSM documents is that functions hold context while dispatching the next operation. For SSM documents, we pushed in-process spans to a stack saved to the local file system. As spans completed, we popped them from the stack and wrote them as structured JSON logs to CloudWatch. Since our SSM documents execute sequentially, there are minimal concerns about concurrency.
For more technical implementation details, the source code for the initial version is on GitHub.
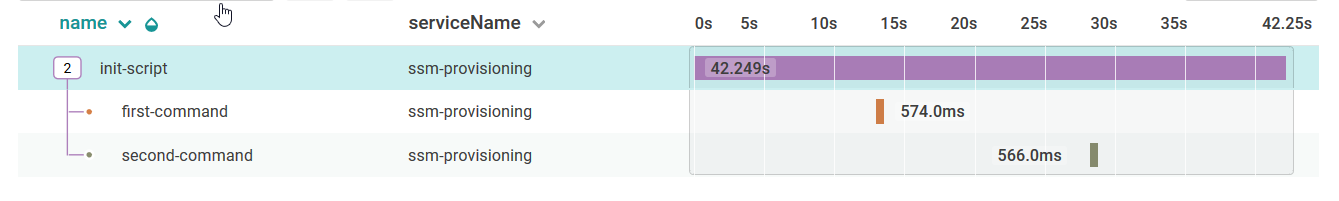 CloudWatch agent latency
The first time I saw the trace from this implementation I was certain there was an instrumentation bug: Why would an SSM document composed of two steps that each write a single line to stdout take more than 25 seconds to complete?!?
The provisioning execution time comprises a fractional percentage of the total execution time. That impact is magnified by the number of SSM documents (typically 15-25 documents) that execute during our primary provisioning processes. With trace instrumentation, that behavior was immediately visible.
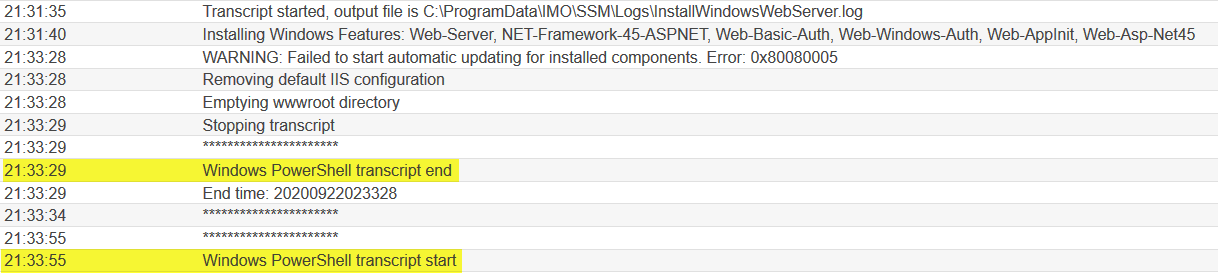 Default log output with highlighting
We’d overlooked past performance issues numerous times while debugging other problems because they were obscured by the log structure. Similarly, the log structure precluded the type of open-ended curiosity we associate with observability:
- What provisioning steps execute the most frequently?
- What provisioning steps fail most frequently?
- Does introducing a new agent version preserve the stability of the system or does it de-stabilized it?
Debugging idle time in our provisioning service
As we debugged potential causes of the issue (shoutout to Narendra from AWS technical support), one detail became clear: we had two performance issues with a similar signature instead of the one we imagined.
The first issue presented when writing logs to stdout and sending them directly to CloudWatch. This was the eyebrow-raising performance issue detailed above.
However, our production provisioning service uses a different strategy to ingest logs into CloudWatch. For this second strategy, there was no detectable performance penalty. Yet all of our telemetry continued to show 10-20 second gaps of time between steps. We estimated three to five minutes of idle time during end-to-end execution. Curious.
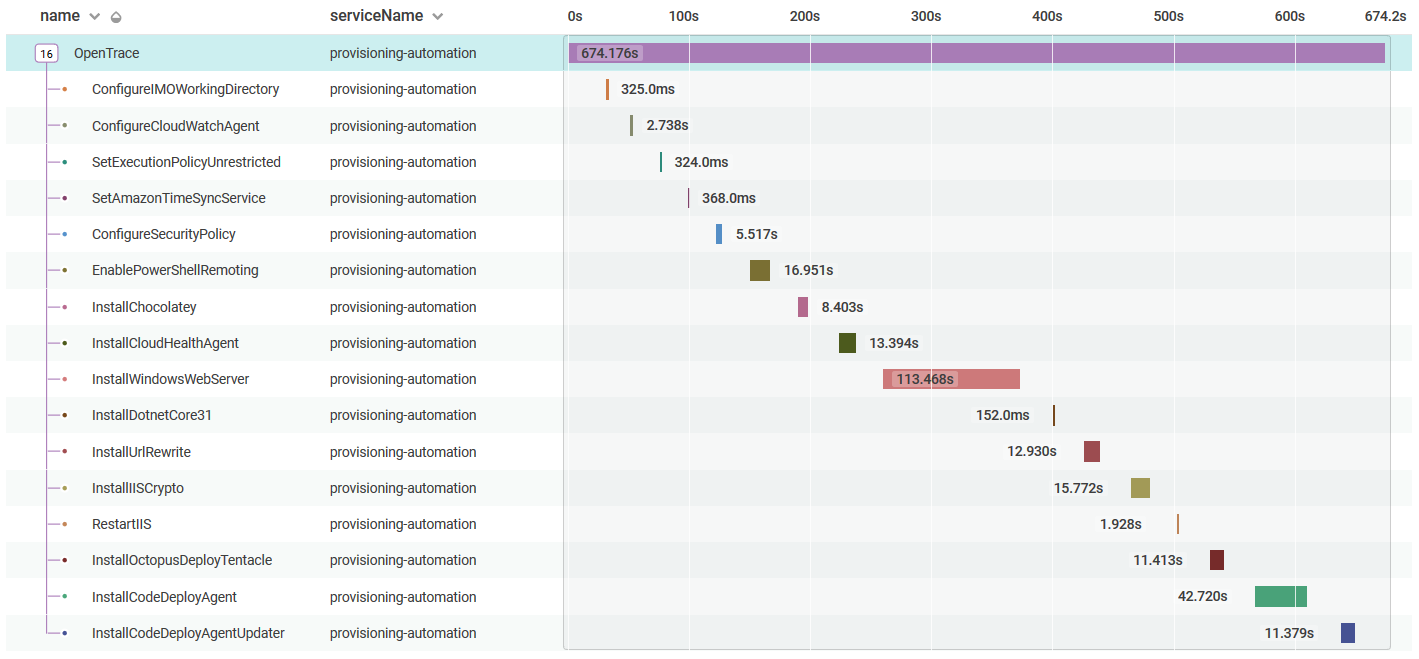 IMO end-to-end provisioning
We slowly unveiled a subtle issue in the PowerShell code that executes during our provisioning process. At various points, we use functions from AWSPowerShell modules to retrieve configuration from a remote source, usually SSM Parameter Store. There’s a significant performance penalty when first importing AWSPowerShell modules into your PowerShell session.
We also learned our strategy for module imports “… are always applied globally, and must be met, before the script can execute.” The performance penalty for importing AWSPowerShell modules occurs outside of any application telemetry that attempts to measure it.
If you want to experiment with this behavior, we’ve included the steps to reproduce in our GitHub project.
Watching code go live to fix the issue
After identifying our implementation of AWSPowerShell as the root of our performance issues, we evaluated an array of resolution options. Caching modules across PowerShell sessions wasn’t technically feasible. Restructuring provisioning documents to execute within a single PowerShell session was a significant time commitment. Rewriting our provisioning service to use AWS Image Builder was the long-term direction we agreed was most appropriate. However, rewrites never happen overnight and change frequently introduces new failures.
In the interim, we added a new step to install the AWS CLI and modified function calls to prefer using the AWS CLI,before falling back to using AWSPowerShell modules if it wasn’t available.
Initially, we deployed the change to our lowest application environment and compared the performance delta.
 A young Leonardo DiCaprio in Romeo and Juliet says “But, soft! What light through yonder window breaks?”
One of our key performance metrics is time from instance launch until application code begins installation. Our logs made this difficult to calculate for a single instance and impossible to measure at scale. Our trace data, however, made this simple: measure what matters to your users.
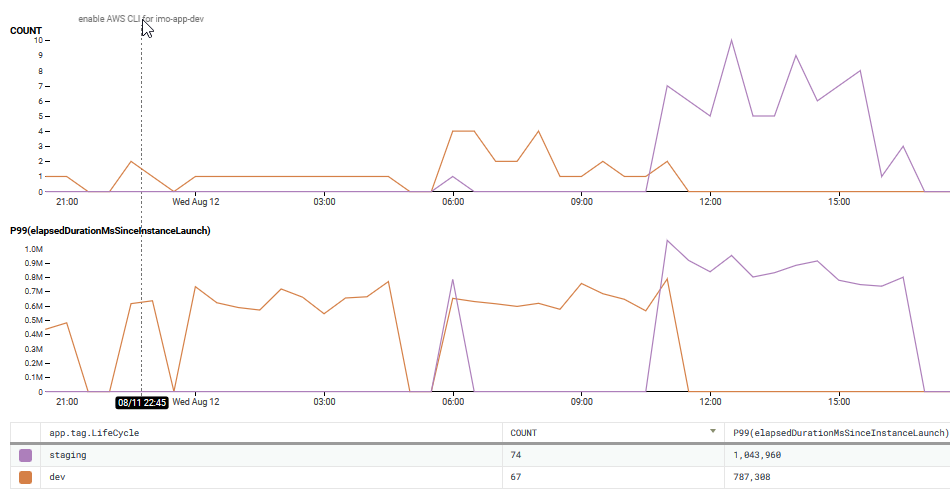 Graph showing performance improvement between account with CLI change and account without
The graphs show a significant performance increase when using the AWS CLI. At the 50th percentile, we improved performance by more than 2 minutes and improved performance by more than 4 minutes at the 99th percentile. In fact, the 99th percentile performance metrics when using the AWS CLI was almost as fast as the 50th percentile times when it was not. ¡Que bueno!
Conclusion
Building observability into the foundation of systems can dramatically reveal potential architectural issues long before it reaches customers. Even experienced peer reviewers frequently cannot predict the way multiple complex systems converge and intersect to magnify performance issues: we were paying performance penalties once per document, not once per end-to-end execution.
Although this issue could have been discoverable in our logs, it remained opaque to us for more than a year until our tracing revealed it. The trace data we generate also provides new insights into how to operate our system more reliably and efficiently.
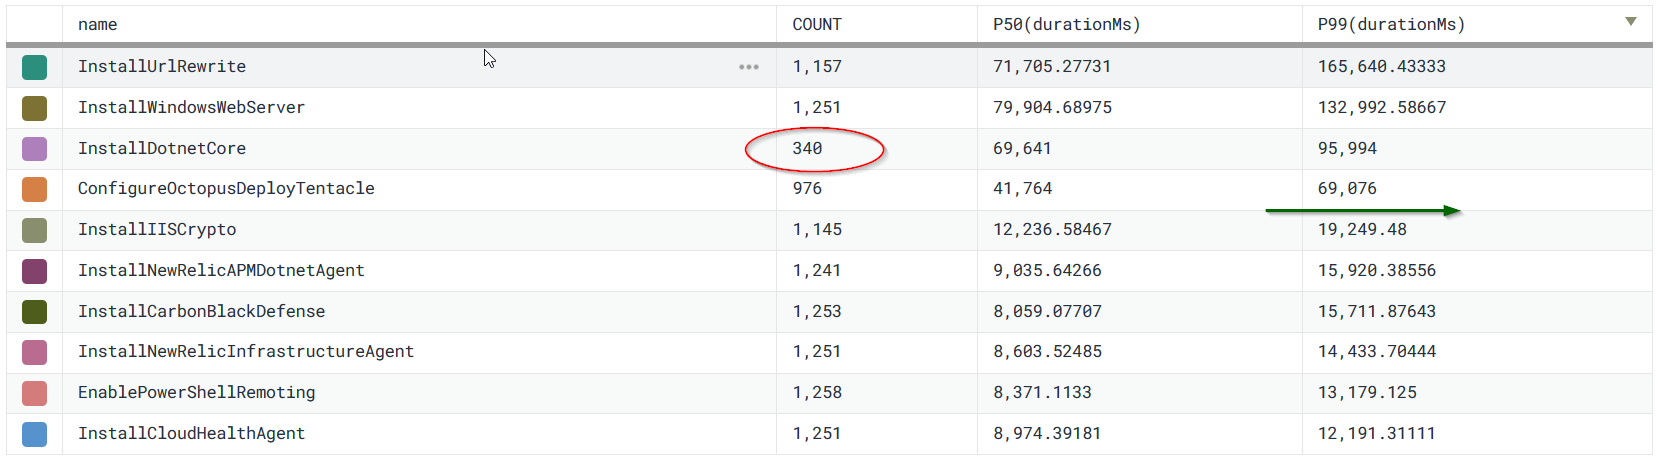 Graph showing execution count and duration percentiles for provisioning steps.
As seen in the above graph, there’s a significant decline in execution time after our four longest run steps. Moreover, one of those longest running steps executes far less frequently than its peers.
If we were to only solve the time-gap fix discussed above and then optimize the three most frequently executed, longest running steps, we could improve performance for one of our key user metrics by more than 9 minutes, or 62% of the total execution.
As Cindy Sridharan notes in her report on Distributed System Observability:
The goal … is not to collect logs, metrics, or traces. It is to build a culture of engineering based on facts and feedback, and then spread that culture within the broader organization
With remarkable economy of language, another familiar CTO expressed her sentiments even more succinctly: “I’m so done with logs.” We’re so done with logs too, Charity.
Join the swarm. Get started with Honeycomb for free.


Top comments (0)