
During my university studies, I attended a course named Statistical Data Analysis. I was excited about this course because it taught me all the basic statistical analysis methods such as (non-)linear regression, ANOVA, MANOVA, LDA, PCA, etc. However, I never learned about the business application of these methods. During the course, we worked with several examples. Still, all the samples were CSV datasets, mainly from Kaggle. I wondered how I could perform some statistical analysis over a database such as Postgres and automate it by creating a pipeline, trying all possible combinations of columns, yielding a result saying which models are better than others. Years passed by, and now I am here to present you with my proof of concept of statistical data analysis automation.
What Statistical Method Will Be Automated?
For my proof of concept, I chose to automate linear regression. I decided on linear regression because I consider this method an entry point to statistical data analysis. Since linear regression has assumptions, I can easily demonstrate how I imagine sorted models from the best to the worst.
What Is Linear Regression, and What Are Its Assumptions?
Simple linear regression is a statistical method that models a relationship between two continuous variables, and if there are multiple variables, we call it multiple linear regression. The most straightforward approach for linear regression is ordinary least squares estimation.
We can extend ordinary least squares estimation with regularization. One of the most known regularizations are shrinkage methods (ridge, lasso). They are called shrinkage methods because they force estimated parameters to be shrunken towards zero, producing reduced variance.
Let's remind ourselves what the goal of the ordinary least squares estimation method is.
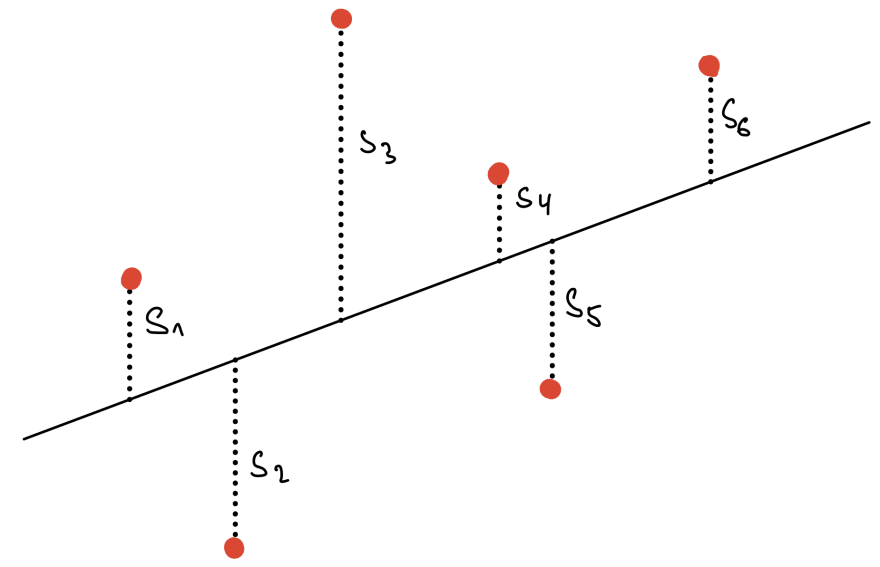
In the figure above, we can see points (red) in space and a line (black). We define residual (s values) as a distance between the predicted value and a point. The ordinary least squares estimation method aims to find the line (line coefficients – intercept and slope), which minimizes the sum of squared s.
In this article, I will consider four assumptions of linear regression. I cannot forget to mention that some method modifications are not that strict about assumptions and can demand them in a weaker form than standard linear regression.
The four assumptions for linear regression are:
- Linearity
- the existence of a linear relationship between variables
- Homoscedasticity
- constant variance – residuals are independent of the predictor variables
- Independence
- residuals are independent of each other
- Normality
- residuals are normally distributed
What Technologies Am I Going To Use?
I'm enthusiastic about Python, so my programming language of choice is evident. I chose to use GoodData.CN – cloud-native analytics platform.
The reasons why I chose GoodData.CN are:
The logical data model (LDM) holds information about attributes, facts, datasets (tables), and their relationships.
Metrics – GoodData.CN allows users to create, store and reuse metrics. Metrics are aggregation functions that do not require any joins and adapt to the context, thanks to LDM.
GoodData's Python SDK allows me to work with LDM, metrics, and access data from GoodData.CN in Python pandas data frame.
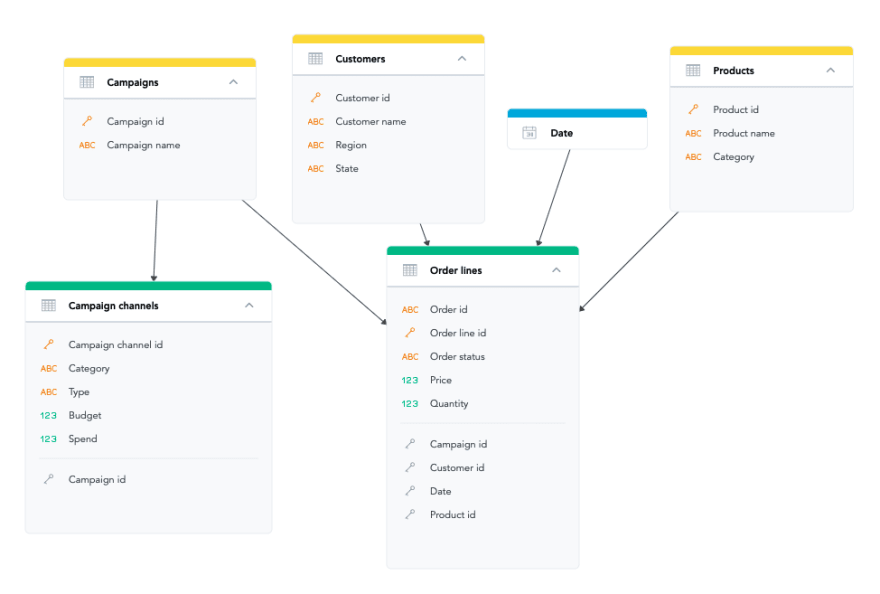
An example of Logical Data Model

An example of a revenue metric containing another metric order amount showing that we can reuse metrics in other metrics.
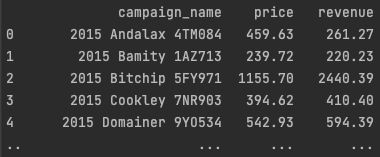
The figure above shows an example of a pandas data frame containing attribute campaign name, fact price, and metric revenue.
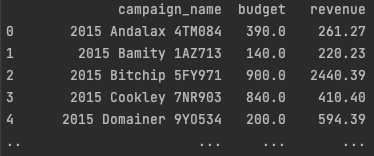
Note that metric revenue without any joins is used, and even though facts budget and price are both in different datasets, we get valid results.
Let's Automate Our Statistical Data Analysis
I will now describe my proposed pipeline, and then I shall present my results.
- Generate all possible combinations without repetition – triplets consisting of precisely one attribute, metric/fact, and metric/fact. Thanks to the logical data model and Python SDK, this task becomes trivial. The logical data model gives me information about what attributes, facts, and metrics I can combine.
- For every combination, get a data frame using GoodData Python SDK.
- For every data frame combination, evaluate linear regression assumptions.
- Sort triplets in descending order of the number of valid assumptions.
- Enjoy your analyzed data.
My proposed pipeline seems quite simple, but the tricky parts are hidden in the details – like what statistical tests are used for assumption validation, thresholds for statistical tests hypothesis, etc. Such details are subject to personal choice.
In the following section, I will demonstrate how simple it is to implement parts of the pipeline mentioned above.
content_service = sdk.catalog_workspace_content
catalog = content_service.get_full_catalog(workspace_id)

# Get attributes
attributes = []
for dataset in catalog.datasets:
    attributes.extend(dataset.attributes)

# Get metrics
metrics = catalog.metrics

# Get facts
facts = []
for dataset in catalog.datasets:
    facts.extend(dataset.facts)
As you can see above, using a few lines of code, you can access workspace content – LDM.
numbers: list[Numeric] = []
numbers.extend(metrics)
numbers.extend(facts)

combinations = set()
pairs = itertools.combinations(numbers, 2)
for pair in pairs:
    valid_objects = content_service.compute_valid_objects(workspace_id, list(pair))
    for a in valid_objects.get("attribute", []):
        attribute = catalog.find_label_attribute(f"label/{a}")
        if attribute:
            combinations.add(Triplet([attribute] + list(pair)))
Using the compute valid objects method, I can find out what other LDM entities I can add to the combination of metric/fact and metric/fact, making a valid combination accessible.
pandas = GoodPandas(os.getenv('HOST'), os.getenv('TOKEN'))
df_factory = pandas.data_frames(workspace_id)
combinations = load_combinations()
columns = list(combinations)[0].as_computable_dictionary
data_frame = df_factory.not_indexed(columns)
The code snippet above is an example of getting non-indexed pandas data frames using generated combinations of triplets.
You can find the code implementing the pipeline above with a script for setting up the GoodData.CN CE environment in the GitHub repository.
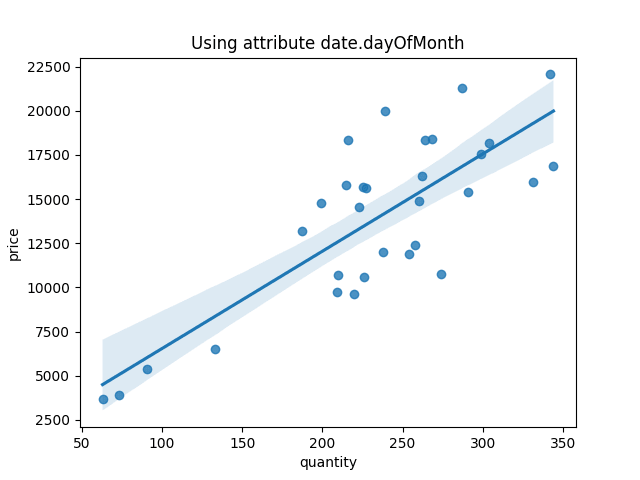
The figure above shows the linear regression returned as the best one with all four passed assumptions.
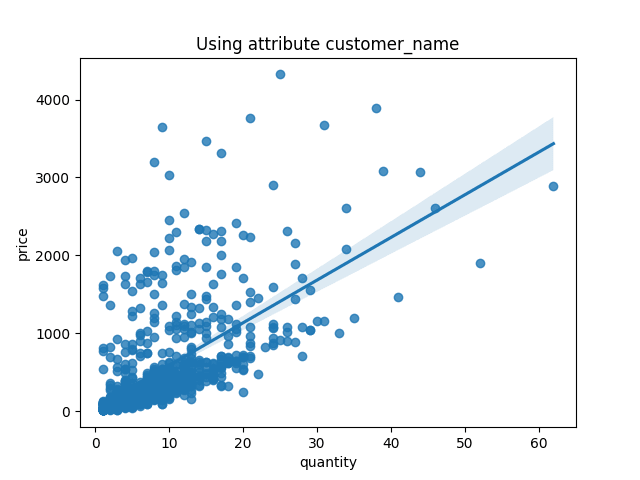
The above example shows the worst linear regression with only one valid assumption - independence.
Potential Simplifications
I would like to address the possible simplifications I noted during the creation of the code. The first simplification arises from generating combinations. In my example, I can omit combinations containing the primary keys of datasets because their role is purely technical.
Furthermore, I found that generating combinations is time-consuming for massive databases, so I propose to create combinations only once, store them using Pickle, for example, and then just load them. I added an option to cache combinations in the code in GitHub, so I encourage you to cache combinations when trying it out. When you add a new column to your database, you can regenerate your combinations or just generate combinations related to the new column and add them to existing ones.
My last noted simplification is related to assumptions validation. Three out of four assumptions need residuals, which means we require the existence of a linear regression model. Linearity assumption does not require residuals, so we do not have to create a linear regression model. We can validate this assumption using, e.g. Pearson’s correlation coefficient, and if linearity is not satisfied, we can omit other assumptions and speed up the pipeline.
Summary
If you've come this far, I thank you for reading my article about my proof of concept. I consider statistical data analysis essential for data analysis, and I find it convenient to simplify work using the right technologies and automate the research process. I welcome any feedback concerning this topic, and I will be pleased to hear from you if you come across any solutions to similar problems. I encourage you to check out my proof of concept and to try it for yourself.
I look forward to seeing your modifications of statistical tests.


Top comments (0)