
INTRODUCTION
Hey there, Here is a data analysis project I did with power BI.
Come along!!!
The dataset used for this project originates from a superstore sales record. Analysis was done in order to answer key questions that reflect some important key performance indicators (KPIs) and to get a proper understanding of the metrics and trends in the dataset.
This project provides an in-depth analysis of the sales record and also provides insights which could augment the growth of the super store.
Data structure
The dataset contains record of sales from 2012 to 2017.
Records in the data include order ID, item type, customer location, order quantity, unit price, order priority, unit sold, total revenue, total profit.
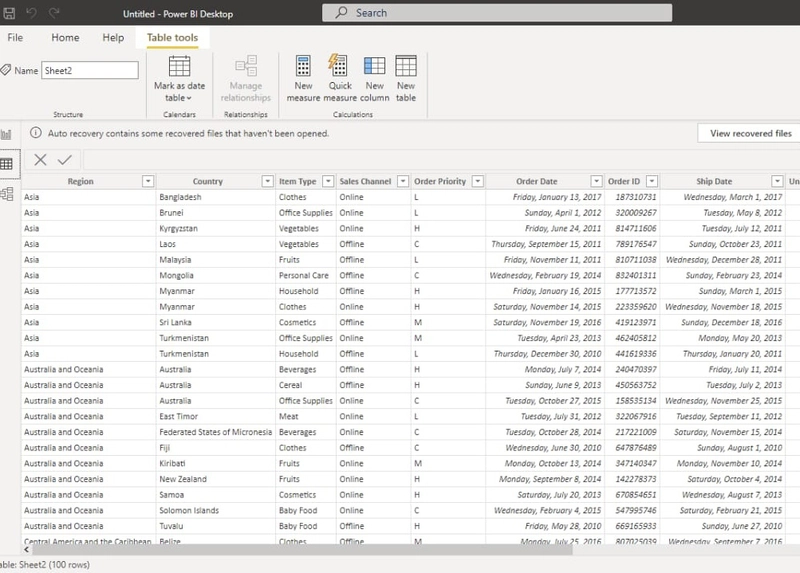
Data cleaning and preparation
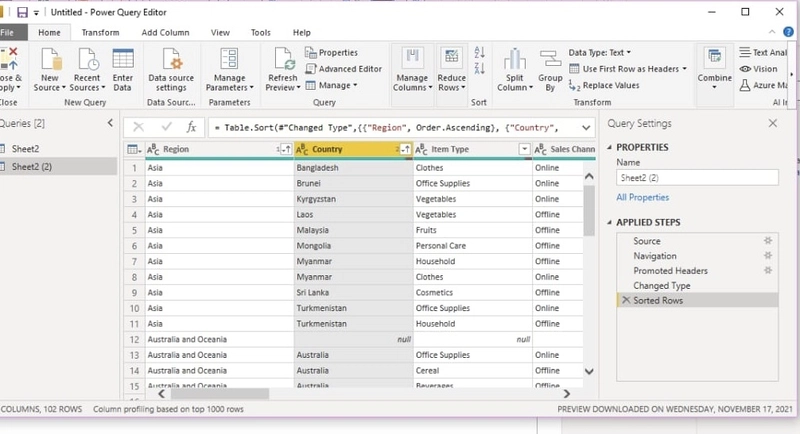
The dataset was loaded into the power query editor of power BI to clean it in preparation for analysis. The dataset had a lot of empty rows across column, these empty rows were removed across the columns.
Misspellings, duplicates, outliers were also removed from the dataset and only unique values were used.
Here is a picture of the dataset after cleaning.
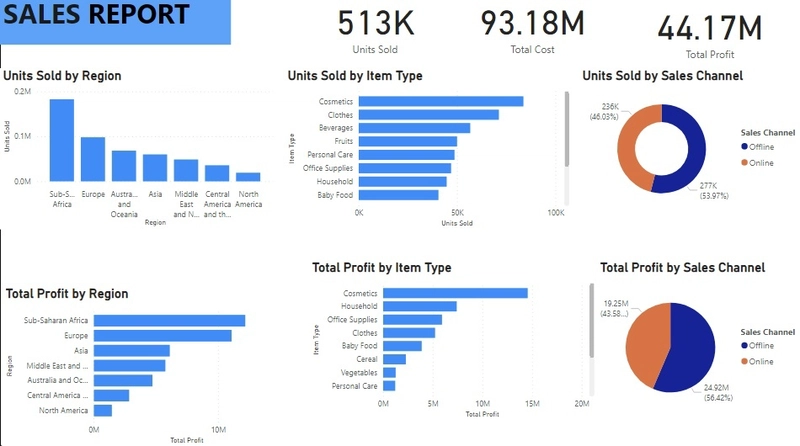
Analysis and insights
Overview of the analysis showed the superstore sold 513k unit of goods and made 44.17 million dollars profit.
The data was used to provide insights to the following:
The sales channel with the most unit of goods sold
The superstore made sales through online and offline channels.
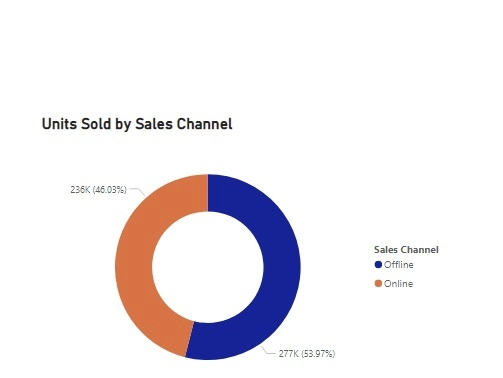
Analysis of the dataset showed the superstore sold more unit of goods offline compared to the online channel.
what channel brought in the most profit

Consistent with the data above, more profit were made through offline sales compared to online sales.
Sales made based on item type
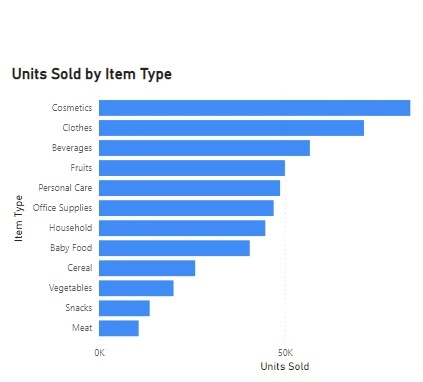
This analysis reveals cosmetics was the best selling item type, and meat was the least sold item type by the superstore.
Profit by item type
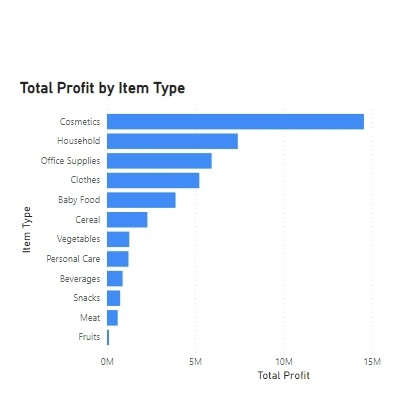
Fruit was the least profitable item type and cosmetics brought in the most profit for the superstore.
Unit sold by each region
The superstore sold goods to eight regions which include: Sub Sahara Africa, Europe, Asia, Middle East, Central America, North America, and Australia.
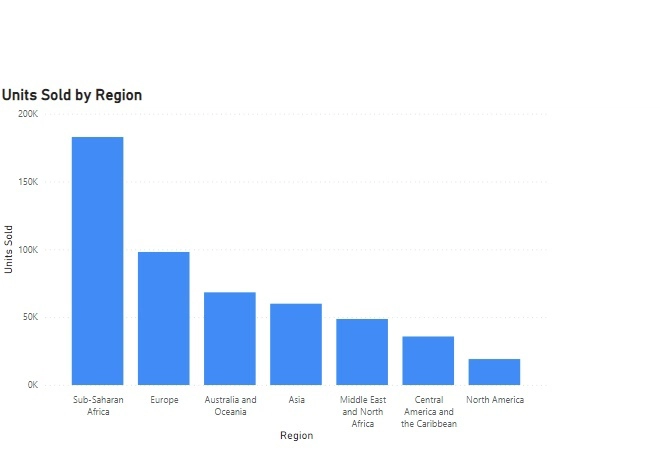
The superstore made the most sales to the Sub Sahara Africa region and the North America region bought the least unit of goods from the superstore.
Total profit made from region
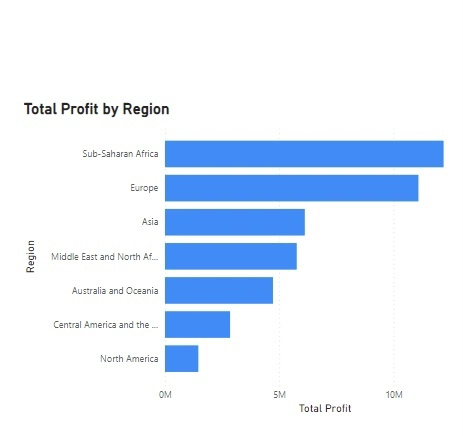
The superstore also made more profit selling to the Sub Sahara Africa region, and made the least profit selling to the North America region.
Strategic recommendations.
More sales and profits were made through the offline channel compared to the online channel. Hence, discounts could be applied to goods bought through the online channel, thereby generating more sales and profit through the online channel.
To aid region with low sales like North America and Central America, publicity of the superstore could be done in those regions to create awareness about the superstore and what they sell. Promotional emails and flyers could also be used in those regions to create awareness. Furthermore, Establishment of the superstore branches at those region could also boost sales.
3.the least sold item type which include meats, vegetables could be made into a combo sale package or special package to stimulate the consumer interest in buying these items.
Here is an overview of the analysis.

Thank you for reading!

Top comments (0)