It begins with an idea of a project on data visualization using Blender. This is my first project on Python: plot-in-blender. I got sufficient responses about its use cases while posting on social media. Created six different types of plotting, categorical plotting, with different materials, and shaders,etc., And the journey continues to its second checkpoint. So far, so good :).Then it's time to write my journey towards this Project.
A little about myself
Let’s begin with Blender. I have been using Blender for about 18 months now, and often witnessed faults in them, sometimes lighting or meshes, and I had issues with reference images too. These made me post my renders on Reddit, an active community for Blender users. I got to see a lot more inspiring projects out there and made me think like “nope, I couldn't get close to any of these projects”. Rigorous fight with my academics made me put off my so-called ‘render activity’. I present before you, my first render. Thanks to BlenderGuru for a beautiful set of tutorials.
Okay then, Let’s talk about Python. I used to be a person of low programming skills in python and these lockdown days marked a remarkable change to be the person I am now. I started with the basic problem-solving section on Hackerrank. It’s true that I lack knowledge in the field of DataScience, and what I did to compensate is that I have started listening to an online course called Data Science Bootcamp by Jose Portilla. That was actually my starter course from which I have got an Idea about NumPy Pandas, Matplotlib, etc. You may also have a visualization on the same, the course is available on Udemy.
Learning Stage
As a FOSS enthusiast, I always wanted to do something with an open-source tool like building an add-on for Blender or a GNOME extension or something to showcase my GitHub account. That made me think about collaborating with Blender and data visualization. I knew how to use Blender and have basic knowledge of data science. Why not combine both, like a Matplotlib library to visualize data, but in Blender, which makes 3D visualization. It will be helpful since it can have one more argument compared to 2D.
Started watching videos on scripting in python. Read the documentation of Blender API. To make sure about the API, I created my first plot using Blender, a not complicated one, a BarPlot. It was an easy task to get it done within 3 to 4 hours with the resources available anywhere online. I was having no issues until this popped up. Struggled to find a solution to pass data to Blender from an external source like python or bash. I made it from python console to bash to Blender! Not sure, if there exists a better solution. I am satisfied with what I did.
v0.1.0-beta: First Checkpoint
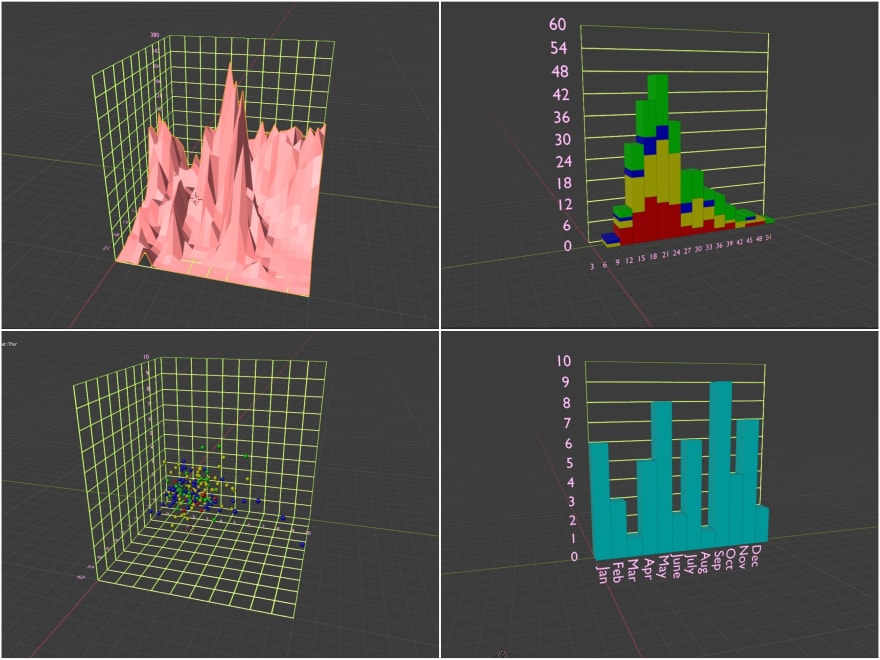
It's time to create a roadmap to compensate for my tight schedule and academics. I completed ScatterPlot (both in 2D and 3D), HistPlot, SurfacePlot. Every plot I made was inspired by Matplotlib, seaborn, and Plotly. Despite these plots, it's time for categorical plotting. I have to study how to create materials and shaders using API in Blender. Around three weeks of study made this goal furnished.
I posted my work on r/Python and r/Blender. Usually, my posts go unnoticed all the time. But, this time witnessed 1000 upvotes on Reddit, which actually made my day. Talking about the r/python community, it is an awesome community with a lot of good devs. Some of them told me that this can lead to VR visualizations with simulations and animations that will be not cheap. To end up with, I received 50 stars on my Github repo, which actually/partially fulfilled my intention to be a FOSS contributor.
v0.2.0-beta: Second Checkpoint
Some developers on the Reddit community insisted me to use PEP-8 coding styles, create a wiki, maintain documentations, GIF on how to use, etc., So, I planned to resolve those. OOP concepts were my first target, I haven’t used them in python and followed procedural styling with the JS style of naming. It wasn’t that hard to migrate from JS to python in case of styling if you have thorough knowledge about OOPS concepts. But things didn’t work well for me as I lack the above-mentioned concepts and stuff. .Although I got to manage them and was able to create 2 more different plots, PiePlot and CountPlot, and did some gradient plotting for SurfacePlotting, adding minor fixes. I planned to stop the coding part with these, now it comes to the lazy part for me (must be lazy for some devs), documentation, and to create a wiki. It was a kind of satisfying but important task to do, will make you spend some time.

Future
As I said, 3D plotting has so many different use cases. If you know how to use Blender, perfect! You can visualize data with such great animations, simulations, and with respective shaders to the data. For me, I have planned to work on animations of plots as the first thing. Creating axes and legends is always one of my priorities. Then, some new plots. Then, maybe to publish a pip package.
Contribute
If you have a new idea for plotting or found a bug or something, please feel free to raise an issue or pull request in my repo.
Peace Out.


Top comments (0)