This post is originally from my blog. I try and write semi-often, but only when I feel I have something interesting to say.
The Mistake, but the question.
As part of the preparation for interviews, I have been re-touching some of the foundational concepts in Computer Science. Some of the more interesting challenges have been relearning and implementing sorting algorithms in Python.
Success has been... wrought with interesting mishaps where my understanding did not quite match the implementation I had written. One of these more interesting mistakes arose from creating a bubble sort.
I will say now- I did successfully implement a bubble sort, but the first "mistake" did lead to an interesting question:
"What is the efficiency of this janky creation?"
The concepts around efficiency are not new to me, but testing and saying what it is for a new algorithm where it is not obvious is a new area.
The Algorithm
On a gist here - in case you ever feel (but I do not know why) inclined to copy it and try it out.
def somethingSort(array):
    pointer = 0
    number_of_comparisons = 0
    while pointer < len(array)-1:
        if array[pointer] > array[pointer+1]:
            array[pointer+1],array[pointer] = array[pointer],array[pointer+1]
            pointer = 0

        else:
            pointer += 1
        number_of_comparisons += 1
    return array,number_of_comparisons
Summarized:
- Compare the current value and the next
- If Current is bigger then the next, swap them
- Reset the pointer back to 0 (go back to the beginning)
- ELSE increase the pointer by one (move onto the next pair of numbers and compare)
- If the pointer is at the current length of the input array, then we have finished sort
I can see the problems very clearly when I summarize it like this. If you happen to be sorting at the end of the array, after you find a pair to swap, you will be sent right back to the beginning. This can cause the algorithm to re-check all the values.. at least twice.
The Analysis
Now, this is the bit I was mostly interested in, but unsure when it came to generating a conclusion. This is an area - scalability- where I believe there will always be lots of questions are left to be answered in some form, as to how things scale informs major design decisions.
All calculations were run at least 10 times for each randomly generated list of up to 500 values long. The randomly generated numbers were between 1 and 100 inclusively.
Comparisons
The algorithm quite nicely (but unfortunately) scaled cubically. This being that for every input, it will do the cube of it in terms of the number of comparisons. For reference:
- Quick Sort has an average nlogn for comparisons - in the worst cases (but rarely) n²
- Bubble Sort has an average and worst of n²
There is an R² value attached to the graph, however this is not a good metric to use, as R² is primarily for comparing linear data to a line of best fit. This is not linear.
Time
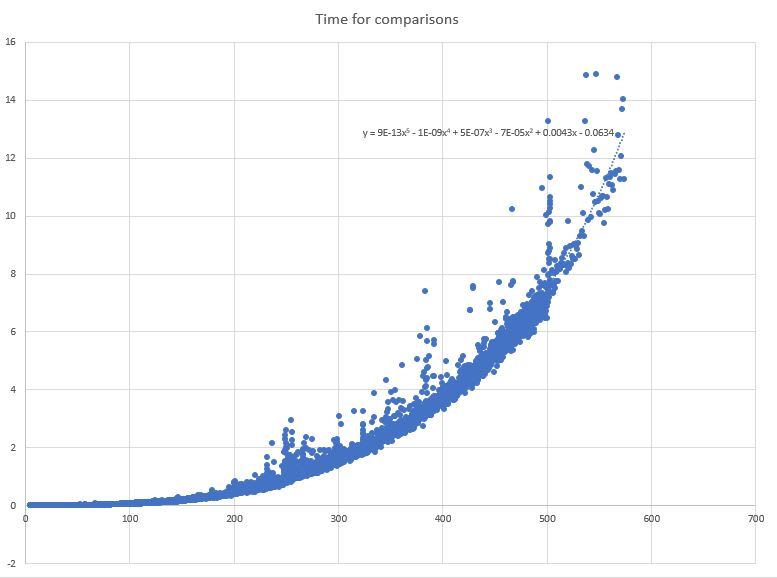
This is the point of data is the area I am least certain on. The time was calculated by recording the time before the calculation and after then taking the difference. All calculations were left on the same computer with the same applications in the background.
The point of the analysis I am not sure of is around what the equation of the correlation line is. As stated before, using R² is a bad choice for non-linear data. My indecision arises around how that value improves when increasing the power of the correlation line. So I am being hypocritical by using it to decide on the equation. It is somewhere between n² and n⁵.
Learning is slow but worth the climb
This is still a new area for me. I really did enjoy re-visiting and programming sorting algorithms. The analysis itself might be a bit off, but I can only improve from there.
I already have in mind improvements for this algorithm, and doing so might mean it is just a copy of one that already exists.
Onwards to more learning about how to presenting data! (Any comments on what I did/could do better.. please provide away)


Top comments (0)