
1. Introduction/Objective
Funding plays a pivotal role in providing the necessary resources and support for startups to thrive. The project focuses on analyzing the funding received by start-ups in India from 2018 to 2021. The main objective is to gain insights into the Indian start-up ecosystem and propose the best course of action for our team's venture. By analyzing the data on funding amounts, start-up details, and investor information, we aim to unearth prevailing patterns and gain insights about the opportunities in India's start-up ecosystem to inform decision-making. To help deduce various insights the following guiding questions were used:
1.1 Research Questions
i. What is the overall trend in funding received by start-ups in India from 2018 to 2021?
ii. Which industries or sectors have received the highest funding during this period?
iii. What is the distribution of startups across the cities in India?
iv. What is the average funding amount received by start-ups in India during this period?
v. Which Investors Funded Most Start-Ups Over the Period?
vi. Which Investors Funded the Most Money on Average Over the Period?
vii. At What Stages were Most Start-ups Funded?
viii. Which 5 Cities Recorded Most Funding?
Project Structure
The Cross Industry Standard Process for Data Mining (CRISP-DM) framework was fully adopted in conducting the data analysis process on this project. The sequential steps followed were:
Business understanding. This stage involved setting the project objective.
Data understanding. This stage verifying the quality of our data (is it clean?) and later exploring and describing our data.
Data preparation. This stage entailed cleaning, integrating and reformatting our data.
Data Visualization and storytelling.
Deployment.
2. Data understanding
The data used in this project was a combination of 4 different datasets. The dataset encompasses information on the Indian startup ecosystem for the years 2018, 2019, 2020, and 2021. Each dataset contains crucial details about funding stages, companies, founding years, funding amounts, investors, sectors, company information, founders, and headquarters locations.
3. Data preparation
During this stage, the datasets were cleaned separately, merged thereafter to form an aggregate dataset used in the analysis. The data preparation stage entailed:
Detecting and dealing with missing values and duplicates.
Splitting Location and Industry Columns: The location and industry columns contained multiple values separated by commas. Only the first value was selected as the primary sector.
Currency Conversion for 2018 Amounts: In the 2018 dataset, the amounts column contained a mix of Indian Rupees (INR) and US Dollars (USD). To standardize the amounts, the Indian Rupee was converted to US Dollars (USD).
Removing commas and currency signs from the Amount column in all datasets. This allowed the amounts to be properly recognized as numeric values.
Correcting misplaced/erroneous values especially in the 2021 dataset.
Dropping an extra column named “column10” in the 2020 dataset: This was to align the columns as this column was not present in other datasets.
Adding “Funding Year” column to every dataset which would enable analyzing the funding trends over time.
Renaming Columns and Concatenation.
Data type conversions (e.g., numeric data mistakenly encoded as strings)
4. Data Visualization and storytelling.
This involves using compelling visuals and charts to present the data in an understandable and meaningful way. To establish a story told by the data on the overall funding of various startups in India, visualizations of various factors that affect the funding were displayed in a dashboard using PowerBI and later published to Power BI service. To help visualize and draw insights the research questions were used as a guide:
Answering the Research Questions
4.1 What is the overall trend in funding received by startups in India from 2018-2021?
A line graph of Total Funding Amount against the year of funding was plotted. To address this question, we used the ‘groupby’ function in python to group the data according to ‘Year Funded’ and aggregate ‘Amount’ by sum.
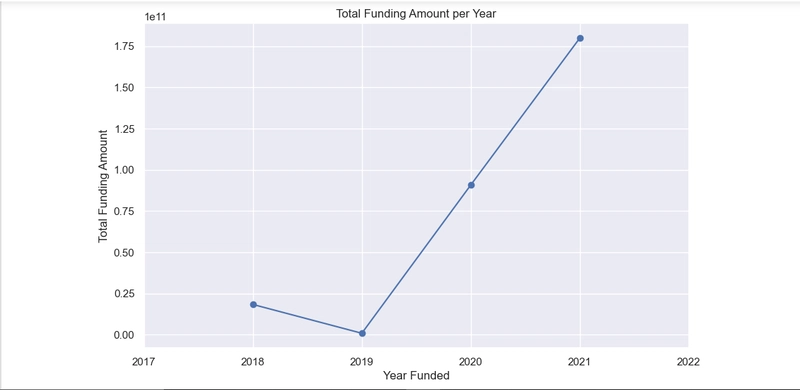
Insights Drawn
For the period 2018 -2019, there was a downward trend in the amount of money funded into startups. From 2019, the money funded has steadily increased.
4.2 Which industries or sectors have received the highest funding during this period?
A bar plot of Sector against the total funding amount was plotted. The data was grouped by the Sector column sum of Funding Amount calculated.

Insights Drawn
From the graph above, Financial Services is the highest funded sector, which is then followed by Commerce and Shopping while the Gaming sector was the least funded.
4.3 What is the Distribution of Start-ups Across the Cities in India?
This question answered the total amount of startups across the cities funded across the time period 2018-2021. A bar plot of Cities against the start-up count per city was plotted.

Insights Drawn
Most funded startups were in Bangalore. This can be explained by most startups having their headquarters located in Bengaluru (Bangalore), which is in the Indian State of Karnataka followed by Mumbai then Gurugram and New Delhi.
4.5 Which Investors Funded Most Start-Ups Over the Period?
A bar plot of investor against the startup count was plotted. The data was grouped by the Investor and a total count of startup calculated.

Insight Drawn
For most startups, their investors were either Unknown or Undisclosed. We assume it makes sense to expurgate such information from our analysis since it will not be of much benefit to our stakeholders.
The leading investor that had invested in most startups was therefore Venture Catalysts, which was closely followed by Inflection Point Ventures. Thereafter came Titan Capital, Tiger Global and Mumbai Angels Network.
4.6 Which Investors Funded the Most Money on Average Over the Period?
A bar plot of investor against the total amount funded was plotted. The data was grouped by the Investor and sum of funds invested calculated.

Insight Drawn
Silver Lake and Mubadala Investment Company are the leading investors who funded the highest average amount into startups.
4.7 At What Stages were Most Start-ups Funded?
A doughnut chart displaying the top three stages when the companies were funded is plotted. The data was grouped by the Stage and a total count of startup calculated.

Insight Drawn
Debt financing recorded the highest funding in the Indian start-up ecosystem with a whopping 84.2 percent share among three top stages of funding over the period of 2018 to 2021. This was followed by venture equity whose series was not known then Series C. These were just 8.3% and 7.5% respectively.
4.8 Which 5 Cities Recorded Most Funding?
A bar plot of Cities against the total amount funded was plotted. The data was grouped by the Cities and a sum of funds invested calculated.

Insight Drawn
According to the analysis, the most highly funded start-ups are in Mumbai as it received over 233 billion dollars over the period. The next was Bangalore, which had a little over 24 billion dollars. New Delhi then came with about 5 billion dollars with just minute gaps from Gurugram and those located outside India.
Conclusion
- By rigorously examining and exploring the data and conducting these analyses, it was discovered that funding dropped from 2018 to 2019 by over 17 billion dollars before rising steadily to 2021 therefore fail to reject the null hypothesis which states that the funding received by start-ups in India has not demonstrated a consistent upward trajectory over the years.
- It also found out that there are significant disparities in funding received during various stages. The debt financing stage received the highest funding over the period with 150.7 billion. Venture capital with unknown series, however, came second with 14.9 billion and Series C with 13.4 billion.
Recommendations
- Situation analysis for a venture into the Indian ecosystem regarding funding of start-ups is particularly important as it is highly likely to receive funding as a start-up when headquartered at Mumbai, Bangalore, New Delhi and Gurugram respectively.
- Alternative financing sources must be implored to support a start-up since most of the start-ups failed to receive highly significant funding at their initial stages. The earliest highly funded was at the Series C stage when it is expected to be a market fit.
- Considering the sector to venture into as far as funding for a start-up in India is concerned is vital as it is more likely to receive funding when at the financial services, commerce and shopping, administrative and education sectors, respectively.
The entire project can be accessed on Github.

Top comments (0)