
Data Visualisation has always interested me, and I am a long time lurker of r/dataisbeautiful. On 1st July 2019, a post about Frequency of Flag Colors by Continent caught the interest of many people. It's from that post that I got the idea to make this visualisation.
The idea was simple (execution was not), calculate the ratio of colours of each flag and colour each country on a map using those colours. I had a previous project which used flag colour ratios to make Atom Icons, so I knew I should be able to do this. Unfortunately, I was wrong, and it took me three attempts to visualise it properly.
Before going into the details of each attempt, here are the sources of data I used.
- Map Source: https://naturalearthdata.com/downloads/
- Flags: https://github.com/hjnilsson/country-flags
Attempt 1 (Python + Geopandas):
In my previous visualisations (simple choropleth maps), I have always used Geopandas. It can export high-quality images very easily.
The first thing I worked on was to calculate the colour ratios for each country present in the map. I modified the code from the following StackOverflow Post to suit my needs.
    for index,row in map.iterrows(): # map is the GeoPandas variable
        country_code = map.loc[index,'ISO_A2'].lower()
        country_data=[]
        try:
            flag_image = Image.open(FLAGS_DIR+country_code+".png")
        except FileNotFoundError:
            continue
        flag_image = flag_image.convert("RGB")
        pixels = flag_image.getcolors(flag_image.width * flag_image.height)
        sorted_pixels = sorted(pixels, key=lambda t: t[0])
        dominant_pixels = []
        for pixel in pixels:
            if pixel[0]*100/(flag_image.width * flag_image.height) > 5: #Top 5 colours only
                dominant_pixels.append(pixel)

        for pixel in dominant_pixels:
            percentage = pixel[0]*100/(flag_image.width * flag_image.height)
            color = "#%02x%02x%02x" % pixel[1]  # HEX Conversion
            country_data.append({"color":color,"percentage":percentage})
        data[country_code] = country_data
The problem in this attempt came when trying to colour the countries. Geopandas can't fill a polygon using multiple colours. For a while, I thought about compromising and fill with the most dominant colour only. Achieving that was also difficult, the nearest possible solution I found was this Github Issue.
I wasn't able to fill the most dominant colour, so I gave up on using Geopandas.
After sitting on it for a while, I remembered that LeafletJS uses CSS to style the maps. So, after saving the flag colours data to a JSON file, I started my second attempt at visualising it, now with LeafletJS.
Attempt 2: LeafletJS
I had high hopes from LeafletJS, and it was successful, to some extent. I was almost right about Leaflet supporting gradients using CSS.
Leaflet makes SVG elements which don't support CSS gradients but their own gradient elements.
I was easily able to colour the most dominant colour but making a gradient proved to be difficult.
I had to create elements for each gradient and link it to each SVG path.
I added the country code to each path using the following code
    onEachFeature(feature,layer){
                layer.options.className = "country " + feature.properties.ISO_A2.toLowerCase()
            },
and then on the add\ event of leaflet map, added the following code
    .on("add",function(){
            for(let pathElm of $(".country")){
                classes = Array.from(pathElm.classList);
                country = classes[classes.indexOf("country") + 1];
                flag = flagData[country]
                console.log(flag)
                $("body").append(`<svg viewBox="0 0 10 10" xmlns="http://www.w3.org/2000/svg"
                xmlns:xlink="http://www.w3.org/1999/xlink">
                <defs>
                <linearGradient id="${country}" gradientTransform="rotate(90)">
                ${flag.map((entry,index) =>{
                    return `<stop offset="${flag.slice(0,index+1).reduce((a,b)=>{return {percentage: a.percentage + b.percentage}}).percentage}%" stop-color="${entry.color}" />`
                })}
                </linearGradient>
                </defs>
                </svg>`);
                $(pathElm)f.attr('fill',`url(#${country})`);
            }
This was able to produce the gradient map like I wanted, but after looking to add attributions, I came across the following disclaimer on the Natural Earth Data Site
Disclaimer
Natural Earth Vector draws boundaries of countries according to defacto status. We show who actually controls the situation on the ground. Please feel free to mashup our disputed area themes to match your particular political outlook.
To avoid issues later, I decided to add the disputed areas map and fill them with white colour.
It took a bit of refactoring, but I was able to easily merge the two maps with the following code.
    L.map('mapid',{
        center: [39.73, -104.99],
        zoom: 5,
        layers: [mapLayer,disLayer]
    });
I thought I was done but exporting the map to a good image proved impossible. I tried many plugins, but none produced a good enough image. A thought came to my mind about copying the SVGs from the developer tools and using Inkscape to produce a good image but Leaflet renders different paths for different zoom levels. Less detailed paths when the map is completely zoomed out and detailed but only the zoomed in portion is rendered otherwise.
This attempt also failed but gave me another idea. Converting Geopandas DataFrames to SVGs.
Attempt 3: Python + GeoPandas (exporting to SVG)
After failing to use LeafletJS, I came back to GeoPandas with another idea. Exporting GeoPandas as SVG and then applying a gradient to it. My initial idea was to add gradients from the Leaflet generated maps but didn't need to.
This blog post helped me a lot in this attempt
I added code from the blog to my code from Attempt 1, and modified it to suit my needs.
# SOURCE: http://kuanbutts.com/2018/08/30/geodataframe-to-svg/
def process_to_svg_group(row,dis=False):
    orig_svg = row.geometry.svg()
    doc = minidom.parseString(orig_svg)
    paths = doc.getElementsByTagName('path')
    pathssvg = []
    country_code = row['ISO_A2'].lower()
    if row['NAME'] == 'France':
        country_code = 'fr'
    if row['NAME'] == 'Norway':
        country_code = 'no'
    for path in paths:
        path.setAttribute('fill', 'url(#%s)'%(country_code))
        path.setAttribute('stroke-width','0.1')
        path.setAttribute('stroke','#000000')
        path.setAttribute('opacity','1')
        path.setAttribute('transform','scale(10,-10)')
        pathssvg.append(path.toxml())
    return ''.join(pathssvg)


processed_rows = []
def_rows = []

res_symdiff = gpd.overlay(gismap, dismap, how='difference')

for index,row in res_symdiff.iterrows():
    country_data=[]
    dominant_pixels = []
    stops = []
    country_code = row['ISO_A2'].lower()
    if row['NAME'] == 'France':
        country_code = 'fr'
    if row['NAME'] == 'Norway':
        country_code = 'no'
    try:
        flag_image = Image.open(FLAGS_DIR+country_code+".png")
    except FileNotFoundError:
        continue

    flag_image = flag_image.convert("RGB")
    # SOURCE: https://stackoverflow.com/a/52879133/4698800
    pixels = flag_image.getcolors(flag_image.width * flag_image.height)
    sorted_pixels = sorted(pixels, key=lambda t: t[0])

    for pixel in sorted_pixels:
        if pixel[0]*100/(flag_image.width * flag_image.height) > 1:
            dominant_pixels.append(pixel)
    print(dominant_pixels)
    sum = 0
    for x in dominant_pixels:
        sum += x[0]
    print(sum)
    for pixel in dominant_pixels:
        percentage = pixel[0]*100/sum
        print(percentage)
        color = "#%02x%02x%02x" % pixel[1]
        perc = 0
        if len(country_data) > 0:
            for x in country_data:
                perc += x['percentage']

        stops.append('<stop offset="%s%%" stop-color="%s" stop-opacity="1"/><stop offset="%s%%" stop-color="%s" stop-opacity="1"/>'%(perc,color,perc+percentage,color))
        country_data.append({"color":color,"percentage":percentage})
    grad = '''<defs>
            <linearGradient x1="0" x2="0" y1="1" y2="0" id="%s">
                %s
            </linearGradient>
            </defs>
            '''%(country_code,''.join(stops))
    def_rows.append(grad)

    p = process_to_svg_group(row)
    processed_rows.append(p)


props = {
    'version': '1.1',
    'baseProfile': 'full',
    'width': '100%',
    'height': '100%',
    'viewBox': '{}'.format(','.join(map(str, gismap.total_bounds))),
    'xmlns': 'http://www.w3.org/2000/svg',
    'xmlns:ev': 'http://www.w3.org/2001/xml-events',
    'xmlns:xlink': 'http://www.w3.org/1999/xlink'
}
template = '{key:s}="{val:s}"'
attrs = ' '.join([template.format(key=key, val=props[key]) for key in props])

raw_svg_str = textwrap.dedent(r'''
    <?xml version="1.0" encoding="utf-8" ?>
    <svg {attrs:s}>
    <g>{data:s}</g>
    {grads:s}
    </svg>
''').format(attrs=attrs, data=''.join(processed_rows),grads=''.join(def_rows)).strip()
with open('out/map.svg', 'w') as f:
    f.write(raw_svg_str)
This was able to produce the map
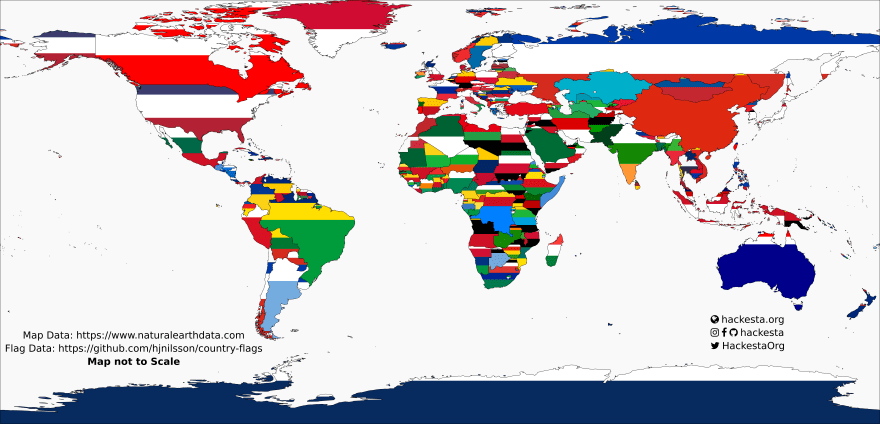
I added the text and background using Inkscape
The curious case of France and Norway
After sharing the map on various sites, many asked about the missing France. I am not good at geography but trusted my code to make sure it didn't miss a country. So I did some debugging and research and came to know that the shapefile I was using didn't have ISOA2 data stored for France and Norway. My code uses the ISO A2 data to match flag files with the map so the missing data resulted in missing countries. I hardcoded a couple of if statements to include both the countries and the code above is updated for that.


Top comments (0)