I was not a big fan of Google Sheets till a few days back. I mean how excelited can you get about a spreadsheet software? Then I found out that Google Sheets can run JavaScript and do cron jobs. Yeah. You didn't misread that. If you are surprised like I was, continue reading. I will show how to write and execute Javascript and run Cron jobs in Google Sheets by building a Covid-19 tracker in less than 15 mins. The idea behind the blog post is to demonstrate how powerful Google Sheet Ecosystem is and how you can build some of your side projects on top of it without writing a ton of code.
For simplicity, we will build a tracker that tracks the total number of cases globally. We need 3 components for building this.
- A Google Sheet to store the date and cases reported.
- Keeping Google sheets in sync with real-time data
- Displaying data from Google Sheets as an Interactive Graph.
1. A Google Sheet to store the date and number of cases
The first thing we need to create is a Google sheet to store the data. You can create a new sheet by going to https://sheet.new.
Use column A of the sheet storing the date and column B for storing the total number of cases reported so far. Now go ahead and name the column A as date and column B as cases

Next, we need to populate the sheet with the historical data of Covid-19 cases. For that, we can use the following API.
https://corona.lmao.ninja/v2/historical/all
This API returns the global historical data of Covid-19. You can click on the link to see how the response would look like.
But how do you fetch the data from the API and insert it into Google Sheets?
For that, we can make use of Google AppsScript.
Google AppsScript is a rapid application development platform that makes it fast and easy to create business applications that integrate with G Suite.
If that doesn't make much sense, you can think of AppsScript as a code editor in which you can run and execute Javascript. It comes with preinstalled libraries that you can use for reading and editing data in GSuite products.
You can access the AppsScript code editor by opening the Tools menu and clicking on Code Editor.
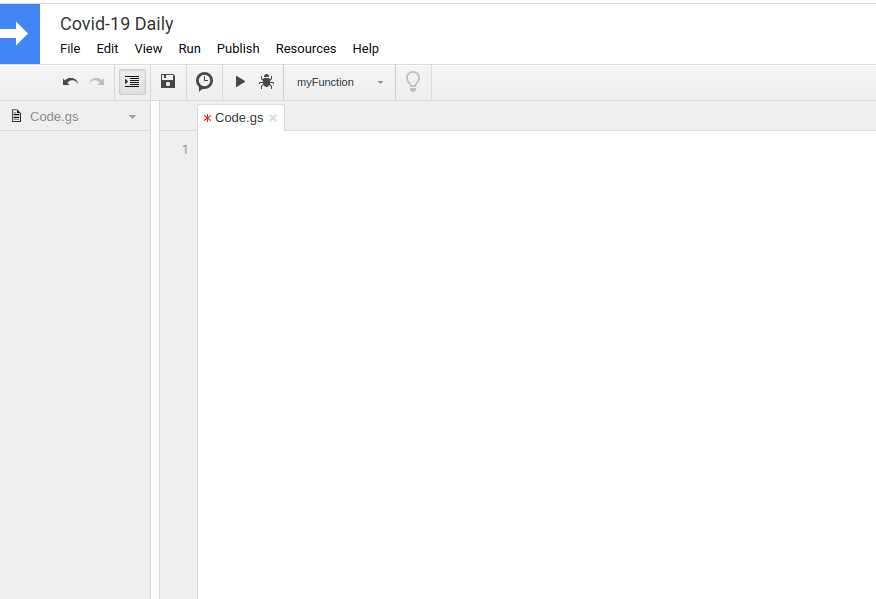
Now copy-paste the following code to the editor.
function getHistoricalData() {
  const url = "https://corona.lmao.ninja/v2/historical/all";
  var response = UrlFetchApp.fetch(url);
  return JSON.parse(response)["cases"];
}

function populateHistoricalData() {
  const sheet = SpreadsheetApp.getActive().getSheetByName('Sheet1');
  const historicalData = getHistoricalData();

  for (const date in historicalData) {
    const cases = historicalData[date];
    sheet.appendRow([date, cases]);
  }
}
The code will make a request to https://corona.lmao.ninja/v2/historical/all, fetch the result, parse and store it in your Google Sheet.
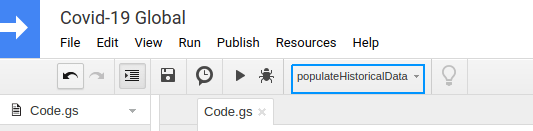
Save the code by pressing the Save option in File menu. After that choose populateHistoricalData as the default function to execute.
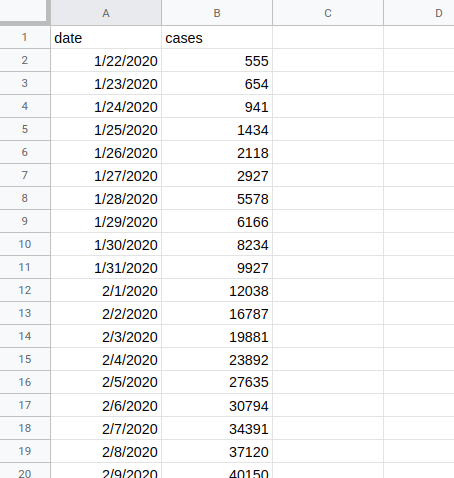
Now click on the run ▶️ button. This will run populateHistoricalData function. The function would populate the Google sheet with the historical data from the API. If everything works fine your sheet would look something like this.
2. Keeping Google sheets in sync with realm time data
The data we have inserted in the Google Sheets is historical and doesn't include the cases of the current day. So we need to figure out a way to keep the sheet updated.
We can do this is by making requests every few minutes to an API that returns the latest data.
https://corona.lmao.ninja /all is such an API.
The following code makes requests to https://corona.lmao.ninja/all and update today's count.
function getTotalCasesSoFar() {
  const url = "https://corona.lmao.ninja/all";
  var response = UrlFetchApp.fetch(url);
  var jsonResponse = JSON.parse(response);
  const casesSoFar = jsonResponse["cases"];
  return casesSoFar;
}

function updateTotalCasesToday() {
  const sheet = SpreadsheetApp.getActive().getSheetByName('Sheet1');
  const todayDate = new Date();
  todayDate.setHours(0, 0, 0, 0);
  const lastRowId = sheet.getLastRow();
  const lastDate = sheet.getRange("A" + lastRowId).getValue();

  const casesSoFar = getTotalCasesSoFar();
  if (lastDate.getTime() === todayDate.getTime()) {
    const oldCountCell = sheet.getRange("B" + lastRowId);
    oldCountCell.setValue(casesSoFar);
  } else {
    sheet.appendRow([todayDate, casesSoFar])
  }
}
Copy and paste the code below our existing code in the script editor. Now choose updateData as the default function and click run. If all goes well, you can see a new row getting inserted which contains today's date and cases so far. If you run the code again it will try to update cases by making another request to the API. An update occurs if there is a change in number.
Now that we have the code ready for keeping the data in sync, we need to figure out a way to run this code automatically. It's not ideal for us to click on the Run ▶️ button every few minutes. What we need is a cron job that runs this script every few minutes. For that, we can make use of Triggers.
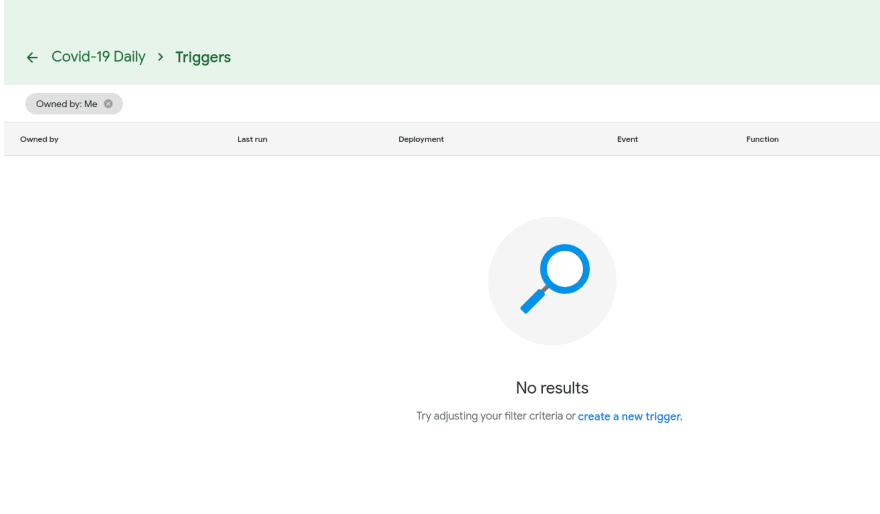
Open edit menu and click on Current project's triggers. This will open a dashboard that looks like this.
You can create a new trigger by clicking one create a new trigger. This will open a form. Set the function as updateTotalCasesToday and event source as Time-driven . You can set the minute interval as you like. In my case, I have set it to every 10 minutes.
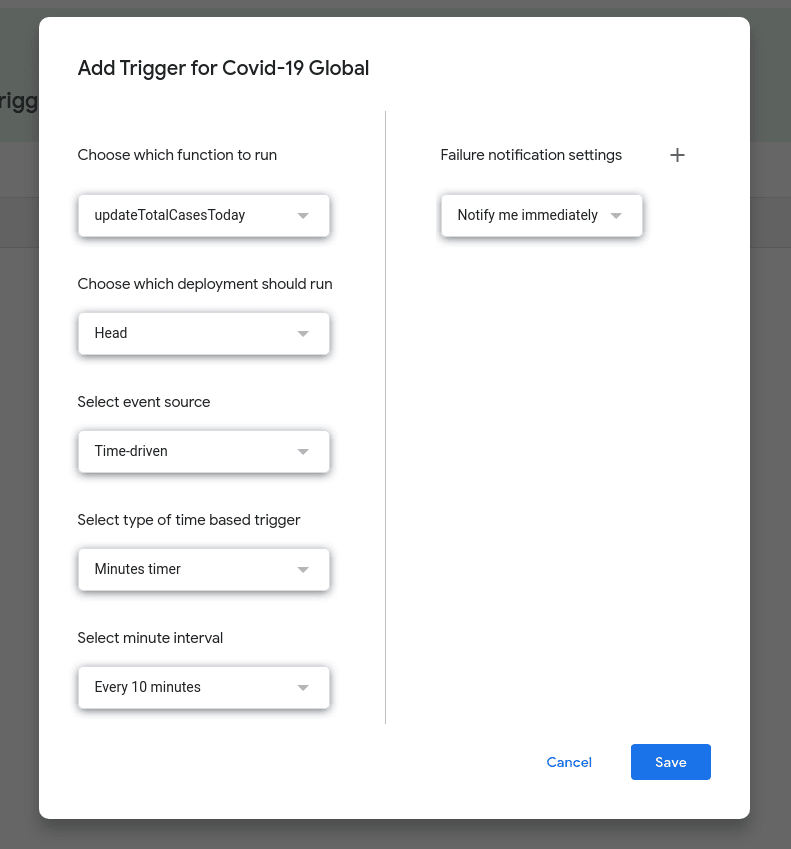
Click Save to create the Trigger.
Voila! Google Apps Script will invoke the function every few minutes.
Now that our sheet is in sync with the latest data, let's proceed to the final step.
3. Displaying data from Google Sheet as an Interactive Graph
For that, we can make use of Google Data Studio. Google Data Studio is a product used for making interactive reports and dashboards. We can use it for creating a time series graph from our Google Sheet.
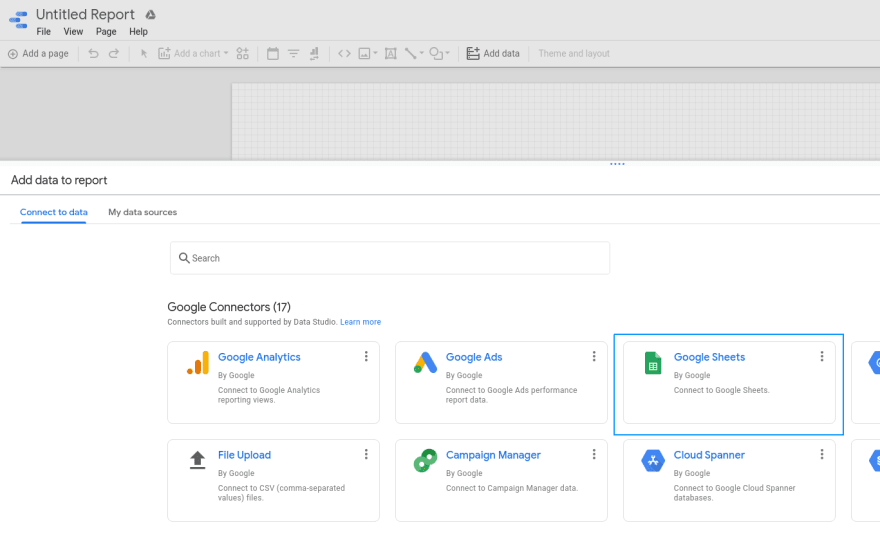
Go to https://datastudio.google.com/ and create a new report.
Now choose Google Sheets as your data source and choose the Sheet that you created in the previous step.
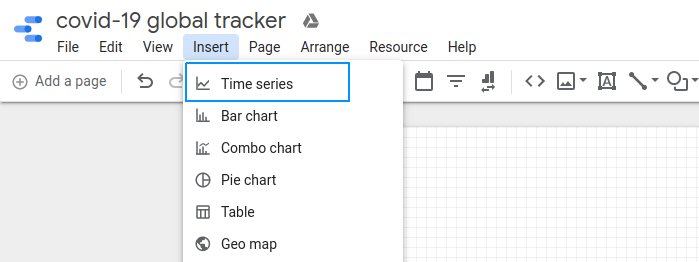
Now click on Insert menu and select Time series. This will insert a graph to your report.
Now in the right side bar set the value of Date Range Dimension to Date and Dimension to Date column. Set the value of Metric to Cases and choose the Max aggregator. Max aggregator uses the maximum of cases values, if there are more than one rows with the same date.

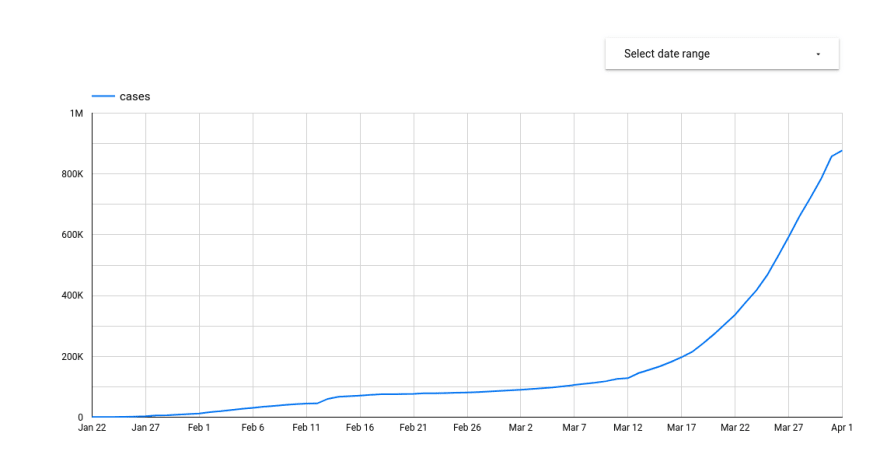
The report should now contain a time-series graph.
You can also insert a Date range that allows users to change the date range. For that click on insert and then choose Date range. The final result would look something like this.

You can share the report with anyone by clicking on Share. See the link below to see how will the report looks like when shared with someone.
https://datastudio.google.com/open/14nOy1s9OWDxNRsGjPHFD1FqyO5MQqT-y
You can also embed the report in any website by clicking on the File menu and choosing Embed report.
Great. We have now built a Covid-19 tracker. To recap
- We learned how to manipulate Google Sheets using JavaScript.
- How to run cron jobs using Triggers.
- How to create interactive graphs using Google Data Studio.
The tutorial is only for demonstration purposes. I would not use the code, data, etc in production without doing due diligence. Hope this blog post was helpful :)


Top comments (2)
Thank you for this! Is there a way to pull this data by state with counties? I see this exists, but I do not know how to code it despite desperately trying... corona.lmao.ninja/v3/covid-19/hist...
Thanks for the Tutorial, Works like a charm. is there a way to get US History in the same way?