
Application Observability. What came to your mind first? I'd bet on metrics related to the server or application, perhaps logs or even the status of microservices. But what about application traces?
Focusing on metrics, we often forget about them. This is compounded by issues of large resources, integration, and more. However, before we get to that, let's start from the beginning.
What are traces?
In the context of system observability, the term 'traces' refers to records or data that document the actions or events occurring within a system, particularly in distributed applications and microservices.
Every trace has its own unique identifier, which allows us to track a specific transaction or request in the system. The main task of traces is to correlate actions in the system with its other parts, ultimately facilitating the diagnosis of problems. This is because it allows for tracing the path a request has taken and locating where issues occurred.
The most common errors detected with traces are those related to database performance, network problems, errors in business logic, and other issues affecting user experience. Since traces are created in real-time, we are able to respond quickly to anomalies.
Grafana Tempo
Among the software responsible for tracing, we can distinguish Jaeger, Zipkin, and Grafana Tempo. It is the latter that I would like to focus on today. Why? It is the fastest of them all, simpler in integration, and migrating to it from other tools is very straightforward. Additionally, Tempo utilizes TraceQL, but more on that shortly. We need to wait just a little longer!

Real life example
Let's move on to a real-life example. As an example, we will use the quickpizza project from the Grafana repository. Why this one? It integrates several different tools from the Grafana stack, which will allow us to see its full potential.
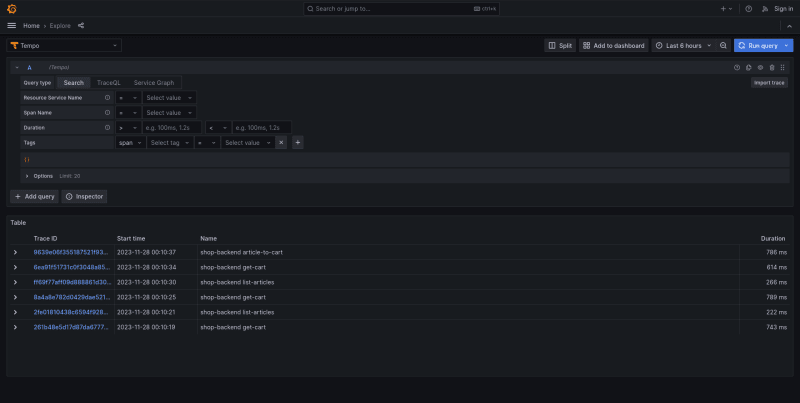
Traces can be checked, among others, from the Grafana interface. For this purpose, you need to go to the localhost address on port 3000. Then, after going to the Explore tab and selecting the Tempo data source, we are ready to explore the data.
UI
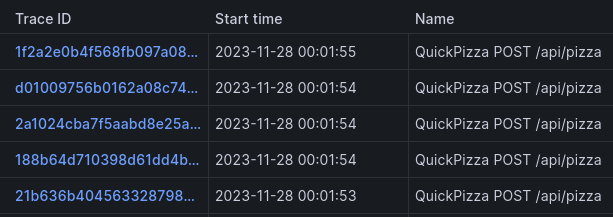
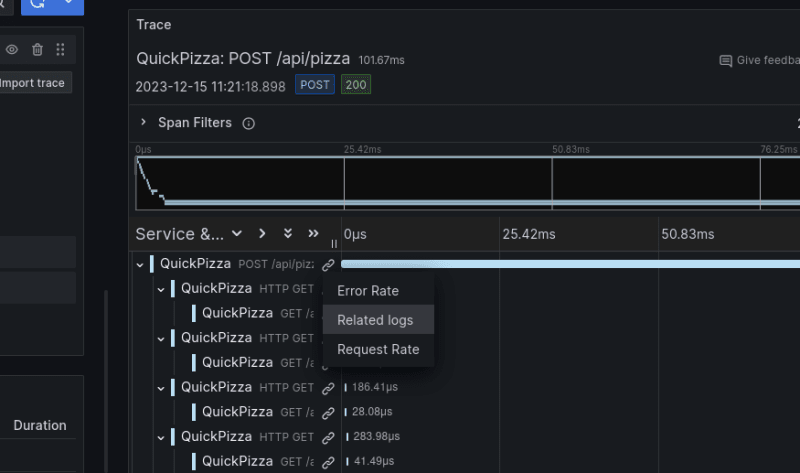
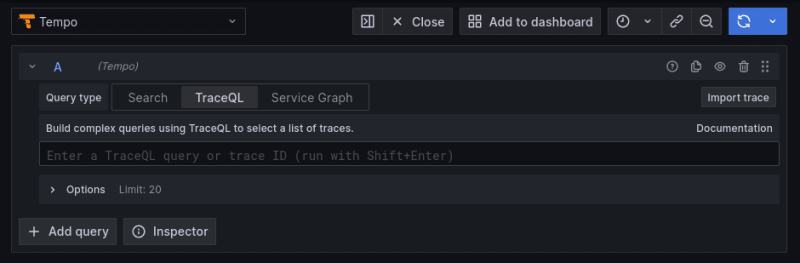
Let's discuss each part of the user interface in turn. Upon entering, we have the option to choose one of three types of queries. The first one is a standard trace search. After running a query, all traces will be displayed in a table. We can filter and sort them.
After entering one of the traces, a panel with calls will be displayed. This is a set of spans represented as horizontal bars, each bar denoting a different part of the system. A span is a unit of work within a trace that has a start time relative to the beginning of the trace, a duration, and an operation name for the unit of work. It usually has a reference to a parent span (unless it is the first span in a trace). It may optionally include key/value attributes that are relevant to the span itself, for example, the HTTP method being used by the span, as well as other metadata such as sub-span events or links to other spans.
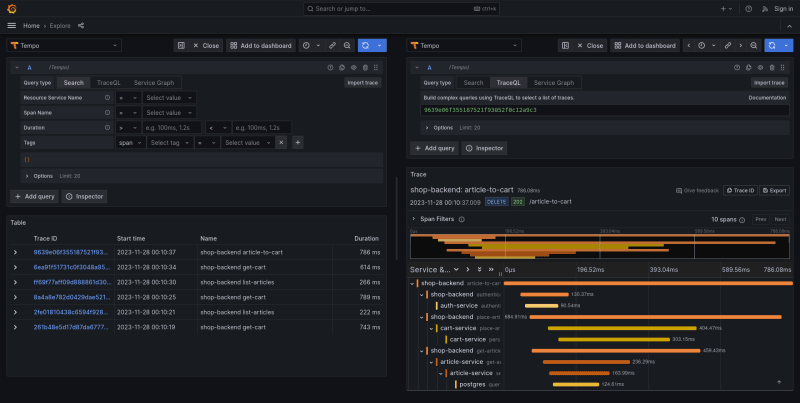
By definition, traces are never complete. You can always push a new batch of spans, even if days have passed since the last one.
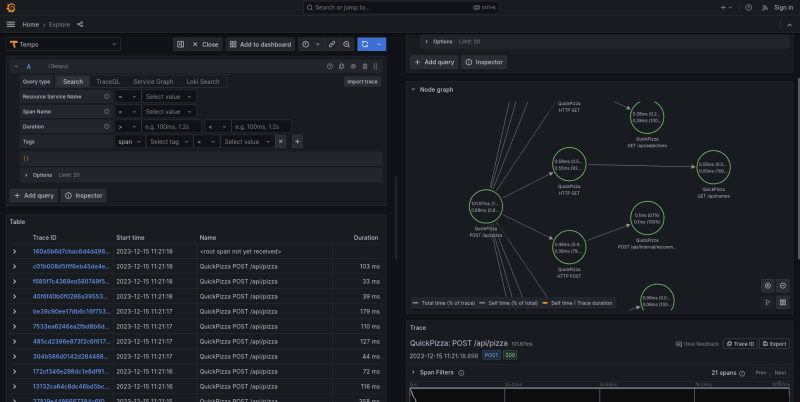
Another important aspect worth mentioning is the ability to open a Node Graph from the Trace level. This allows for the visualization of the flow of subsequent requests to specific endpoints and services on sites. Thanks to this, we can understand the application's operation scheme at a low level.
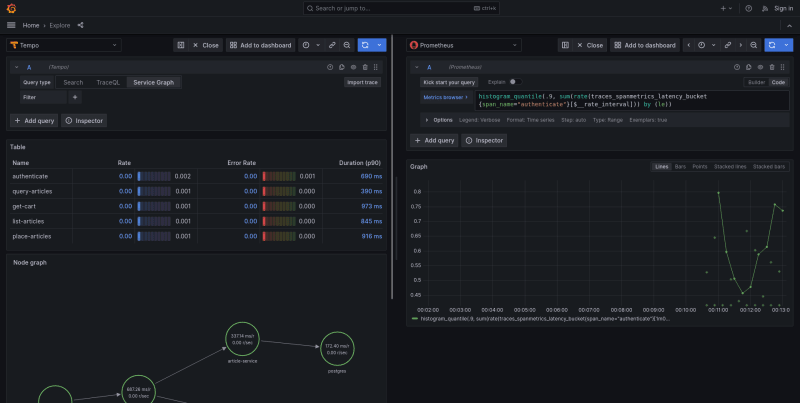
Grafana Tempo stands out among other tools in that by using Tempo with tools from the Grafana ecosystem, we are able to identify specific metrics and logs based on the trace identifier from Tempo. This is important as it allows for the efficient construction of a tool ecosystem from the Grafana Labs stack.
Another interesting element of the Tempo dashboard is TraceQL. This is a query language for Traces, inspired by PromQL and LogQL. Besides being efficient and fast, there isn't much more to say about it. In summary - it exists and works well.
An important element in the context of Grafana Tempo is also the Service Graph View. It presents two significant elements. The first is a table with spans divided according to name. On these, we can find performance-related metrics such as call times and the number of errors that occur. Upon entering one of the metrics, a chart displaying the distribution of metrics over time will appear on the right. From this level, we can also change the type of metric.
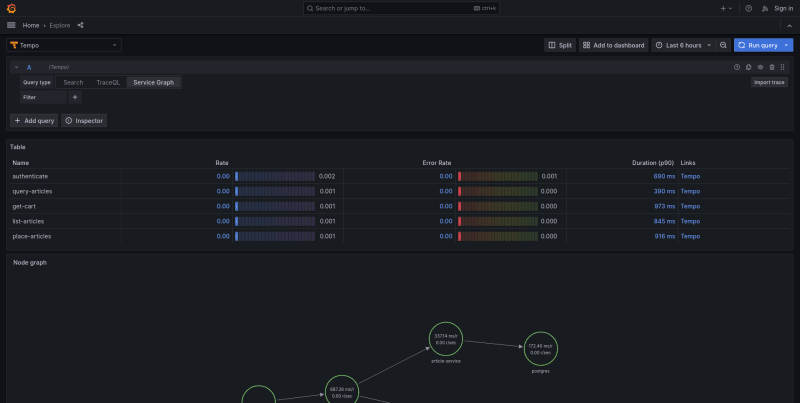
The second element is the Node Graph. It is a visual representation of the interrelationships between various services. Service graphs help to understand the structure of a distributed system, and the connections and dependencies between its components.
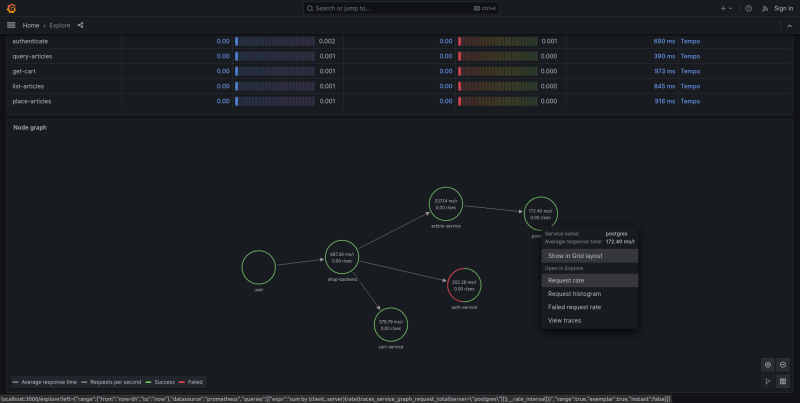
Service graphs infer the topology of a distributed system, provide a high-level overview of the health of your system, and a historical view of a system’s topology. Service graphs show error rates and latencies, among other relevant data. The service graph layout can be either default or grid.
Summary
In summary, traces are an invaluable tool for software engineers and system operators. They not only allow for immediate response to anomalies but also enable a deeper understanding of application behavior in production, which is essential for continuous improvement of performance and reliability. Grafana Tempo is a valuable part of the monitoring tool ecosystem, facilitating the management of traces and integration with other Grafana Labs products.


Top comments (0)