
Optimizing Angular
Update 7 June '19: Seems the bit about the shared module is incorrect. Angular compiler actually tree shakes unused components and does not tree shake unused providers (services). See detailed discussion here
Optimizing primarily for snappy user experience! We’ll take a look at what types of lazy loading we can do and how to measure our results while optimizing Angular.
We'll be optimizing primarily for snappy user experience. That means smaller bundles and not downloading code that is not required. We want to ship the bytes that user needs and nothing more. That way our users will see a snappy and quick to react site. Users have come to expect that.
Disclaimer: No server-side rendering will be discussed here. We’ll try to optimize the javascript that gets delivered and evaluated in the browser.
We’ll take a look at what types of lazy loading we can do and how to measure our results while optimizing Angular.
Here is the plan: We’ll measure first. We’ll create hypotheses. Then we’ll apply some optimization, measure and see if the hypothesis is correct or not.
I’ve created a small example app to exercise the optimizations. Find it at https://github.com/gparlakov/optimizing-angular
Measurement:
We’ll use these tools:
Webpack bundle analyzer. It’s a tool that takes the output from ng build --stats-json command and presents it in a very nice graphical interface. It uses the stats.json file from the output . We can see how many bundles we produce, what goes where and the size of them (Stat — raw, Parsed — processed [like after minification] and Gzipped). Here’s an example:
ng build --prod --stats-json
webpack-bundle-analyzer dist\stats.json
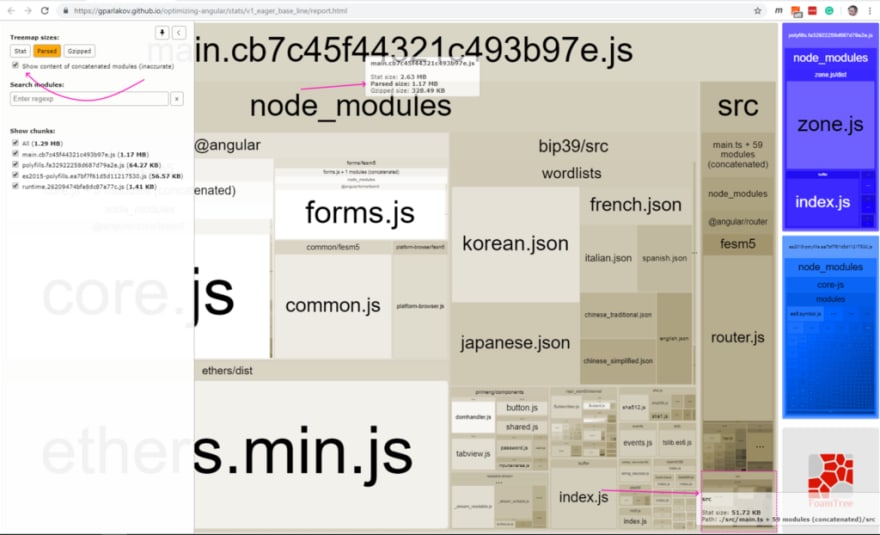
I the screenshot (or if you visit the above link) you’ll see that main bundle is by far the largest — with 1.17MB Parsed (how much disk it takes up) and 328KB Gzipped (estimation**). It includes the angular runtime and libraries (@@angular - core.js, forms.js), ethers* andbip39* , primeng/components — our UI components and a bunch of smaller and larger js files all bundled into one — including src where our apps custom code is. This answers the question — how much javascript do we ship to the browser in order to draw our app.
*These are libraries used for crypto stuff. I’ve selected them because I know they have a large footprint. They will help show one particular aspect of optimizing.

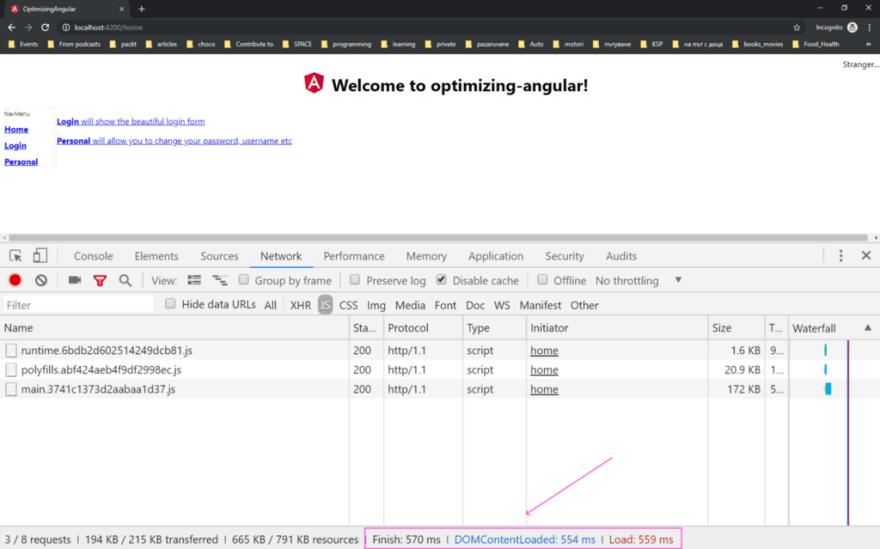
It shows a summary of how much and how fast the resources (filtered to JS in this case — notice the JS selected in the filter bar above) have loaded.
Seems this is already a quick loading app. But considering there are three pages with minimal content I think we can do way better.
**There is some misalignment between the webpack-bundle-analyzer report (showing 328KB main) and the network tool (showing 373 KB). Since this is served by the angular development server (ng serve — prod) I’m guessing different versions of gzip is the explanation. Anyway — we’ll take the size of the bundle as seen in the report as indicative to the actual bytes being transferred and factor in that the concrete implementations (nginx, IIS, Apache, etc.) might result in a small difference in size when squeezing our bundles.
And the chrome dev tools performance tool:

From the performance shot above, we can see the main.d72a….js bundle takes the bulk of the network and a lot of time getting evaluated.
When measuring take care to use the incognito window (in Chrome and whatever the other browsers call it), or disable any extensions that might interfere. In my case, I had two extensions that added about 700 ms to the measured load time. So I did all my measurements incognito.
All measurements are done with --prod flag set in the ng build or ng serve commands. Otherwise, we’ll get source maps, unminified javascript and a lot larger bundles altogether.
With that said, this is our baseline:
Baseline
All right, we have our baseline:
1.17MB size of main.js (328k gzipped)
830ms load time.
217ms evaluating main.js
Now to the fun part — the optimizing.
Lazy load
Hypothesis: lazy load will help speed up the initial bootstrap time and quicken the user experience.
Lazy load is the technique to only load the modules needed and leave the rest on the server until required. For example, our app has a home module, login module, and personal module. Every one landing on the home page needs the home module. But not everyone is going to log in or use the personal profile page. So the login and personal modules will remain on the server until the user actually requests to use them. That way we keep the app loading quickly and save the user’s data plan. (Again this example app is small and a bit contrived, but trust me I've got a point).
Initially, we have all our modules and components loaded eagerly at the start of our app. Hence the build only creates one bundle — main.js — and concatenates everything — vendor code and our custom code — into it. Our initial app-routing.module and app.module look like this:
In order to instruct our bundler (Webpack) to create separate bundles for personal and login modules we need to not import these modules in our app.module and use the special syntax to load them lazily (of course that’s the @angular/router’s special syntax telling angular which modules to load lazily):
This is enough to result in two new bundles that do not get loaded immediately with the first request. And if we do theng build and webpack-bundle-analyzer tool routine we get:

And if we measure the network we get:
And running the performance tool we get:

Results
455KB size of main.js (126k gzipped) (50% reduction)
~600ms load time. (25% reduction)
183ms evaluating main.js (~20%) reduction
Hypothesis: lazy load will help speed up the initial bootstrap time and quicken the UX.
Hypothesis is proven.
All right, we are getting somewhere. Keep in mind that when we navigate to /login and/or /personal we’ll have to pay the network and javascript “price”. Still — on our main page we’ve hastened the UX considerably.
Large dependencies
Next, we can take a look at personal module. Among other things, it allows for creating a crypto wallet. Because that’s what our example app deals with — Crypto! (It may look a bit contrived, but I actually had to deal with a similar setup while optimizing a production app — https://propy.com — where buying real estate with crypto is a thing.)
The personal module depends on ethers and bip39 and their dependencies, but is only ever used when the user creates a wallet. This happens generally once per the user's use of our app. Ever. It would be nice if we could instruct Webpack to create a separate bundle for them and only load it when we need it. Turns out we can. In short, there is a syntax we can use when using import() to instruct Webpack to treat these as lazy loaded modules. We need to have our tsconfig.json modules set to esNext (or commonjs ) in order for the Typescript build to succeed.
Hypothesis : we can further increase the perceived speed of our app by separating the rarely used and very large dependencies into their own bundle. And only load them when needed.
So now running our webpack-bundle-analyzer tool afterng build --prod --stats-json we get:
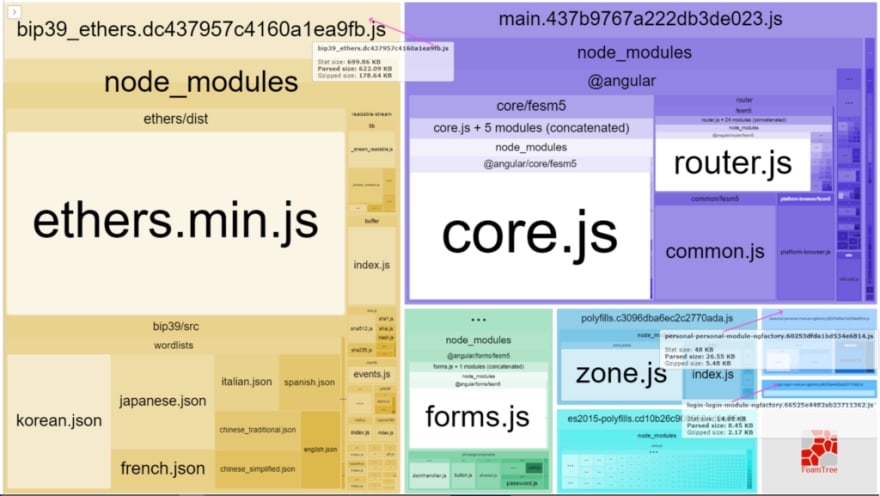
So now we’ll only ever load that dependency if a user decides they want to create a new wallet.

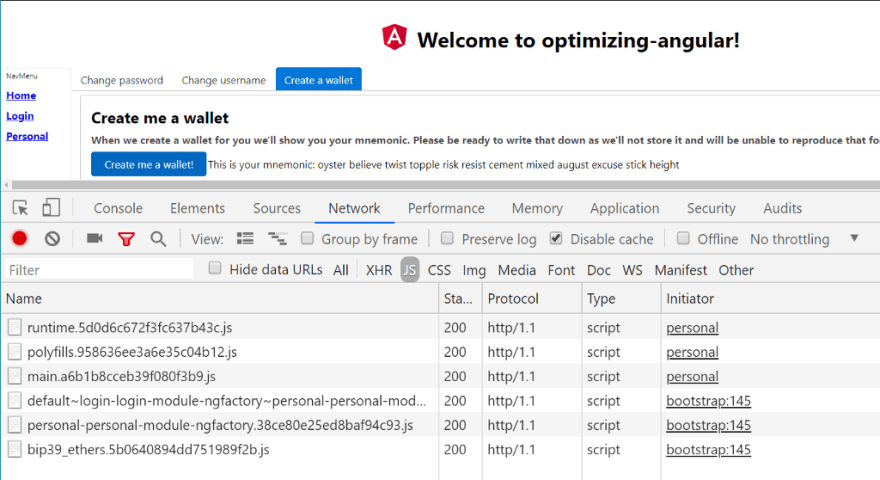
bip39_ethers bundle is just now downloaded.
We have not changed the size of our initial javascript or page load time, but we saved a lot of users a lot of data by deferring the large dependency, to the last possible moment.
Hypothesis : we can further increase the perceived speed of our app by separating the rarely used and very large dependencies into their own bundle. And only load them when needed.
The hypothesis is proven.
Shared bucket
Update 7 June '19: After a question resulting in this answer here it seems this part is not correct. In short Angular does tree shake away unused components but not unused providers (services).
Next, I want to mention the shared module/folder. It is a module that gets all components that will be shared in our app. In order to keep DRY (I really hate that principle, as it often leads to disaster) we devs try and keep everything reusable. Where to put a shared component? The /shared folder. And since it is in the /shared folder, let’s declare and export it in the shared module. Makes sense — right?
Monkey see, monkey do and everyone on the team does the same. It’s obviously a shared component. Put it in the /shared module. In our app, we have two components in our shared module. I created it in a few hours, alone. One of them — the menu component is and it is a dependency of our root component’s module.
Imagine a few months of team-work. The shared module now has hundreds of declared components. But our app-component only needs one or two of them — the rest are used by the feature modules. Despite that our main module will import and build the components and our main bundle will include all that code. So now if you want to get the banana, you get the banana and the monkey, holding it and the whole jungle!
How can we avoid that? There is no easy answer I can give. My team, we have that situation at the time of this writing, and we are dealing with it by:
- Awareness — telling the whole team that this is an issue and why it’s one.
- Create new components in the /shared folder with their own modules. Now any module that needs them can import them.
- Trim the fat off the shared module by taking components out of it and moving them to their own modules. One component at a time. It will take time, but it’s worth it.
(What do you do — share in the comments.)
The hypothesis here is that if everyone on the team is aware of the issue and we work together at it, bit by bit we’ll have a solution.
No evidence to prove that, other than that: I see my teammates trying their best to improve on the situation and separating modules every chance they get. I believe we’ll make it work. One module at a time.
To recap:
We started with one eagerly loaded app and managed to split it into lazy loading modules. By that, we potentially increased the app’s perceived performance, or in technical terms: snappyness. We managed to pinpoint and further separate out rarely used and large dependencies. That way saving user’s data. We talked a bit about the ‘shared’ module (bucket, kitchen sink if you prefer) and why it’s an enemy of the ability of the app to get segregated into lazy loaded modules with clean dependency trees.
If you want to try it out, one step or more, you can. I’ve tagged the steps: 1-eager, 2-lazy, 3-lazier, 4-deshareify .

Top comments (0)