
If you are a football fan, you’d die to have Messi join your squad. Would your team win the championship? Would it at least avoid relegation? Since Messi cannot join everybody’s team, we choose to use data and simulations to infer the answer. The EA Sport’s Fifa dataset is our proxy for player characteristics and TDA (topological data analysis) the spice to model the probability of the outcome of each match. Using simulations on those probabilities, we generate the most likely final ranking of the Premier League.

Messi is only joining Aston Villa in our Python Jupyter Notebook
Who do you need to beat Klopp this year?
Our model allows you to compose your squad, and to measure the overall effect on the team’s end of year position in the leaderboard. Try the model for yourself, get the python code, and get data here for: matches, odds, tda features, player stats, player names (original source).
Modelling
ASSUMPTION 1: THE OUTPUT OF A FOOTBALL MATCH DEPENDS ONLY ON THE SPECIFIC AND COMBINED ATTRIBUTES OF PLAYERS ON THE FIELD.
Most coaches will disagree with this assumption because we are omitting the non-negligible influence of things like team-spirit, weather, tiredness due to intra-week matches, injuries, yellow/red cards, substitutions, tactics, personal commitment of individual players, time of the season, special commitment of fans and many other internal and external factors that can influence the outcome of a match.

Walter Mazzari, former Watford manager, became a reference while he was at F.C. Internazionale in 2014 for the iconic sentence: “we were playing well, and then it started raining”. (source:https://www.standard.co.uk)
Having said so, you might have figured out the first undeniable truth:
Our model is clearly wrong (as any model is…).
Whoever has been on the field as a player, coach, fan, steward, bench warmer or gardener knows that when it comes to predict the outcome of a match, the amount of information to be taken into account is wider than the information that can be recorded. A ferocious scream from the stands, a mistaken whistle from the ref’, or the shrimps on the lunch menu may jeopardize the whole outcome of the match. Some respected scientists claim that football is just random or as hard as proving Fermat’s last theorem (except we have 129 pages of mathematical proof for the latter).

Professor Andrew Wiles proved Fermat’s last theorem in 1994. After 358 years we finally have a proof that “there are no whole number solutions to the equation x^n + y^n = z^n when n is greater than 2, unless xyz=0”. Will somebody ever find a solution for predicting the outcome of football matches? (source:http://www.ox.ac.uk)
We are of course aware that no predictive model can perfectly predict the outcome of football matches. Our ambition is rather to see whether the agnostic methods of topological data analysis can identify relevant patterns in the minuscule set of seven aggregated characteristics for each team.
We use the 24 attributes given to each player by EA to engineer attack and defense features. The initial attribute correlation matrix gives directions to build the latter. To generate features for the whole team, we build the following 7 features based on the initial match composition:
· Rating of the goalkeeper
· Maximum attack value in the team
· Maximum defense value in the team
· Average attack in the team
· Average defense in the team
· Standard deviation of attack in the team, in percentage
· Standard deviation of defense in the team, in percentage
We train a model to estimate the probability of each match outcome based on 2591 matches from the past six Premier League seasons. We test on the 380 matches of season 14/15 for which we provide a simulation of the final leaderboard.
Motivation
It is the 31st of December 2011, Sir Alex Ferguson is turning 70 and Manchester United, at Old Trafford, is playing against Blackburn Rovers, the very last of the leaderboard. During their last match together, the Rovers suffered an abysmal 7–1 defeat. That night, those who were expecting another demonstration from Ferguson’s team would be very surprised. Leading 2–0, Blackburn seal the fate of the match 3–2 with a victory goal in the last 10 minutes.
That night the lucky betters were making 28:1 at the bookies.
Unfortunately, this miracle win at Old Trafford didn’t save Blackburn from relegation. On the other hand, these points would reveal fatal for the red devils in the long-run. The missed opportunity that night lead to an incredible tie at the top of the final leaderboard. City and United both closed the season with 89 points. Thanks to a better goal difference, the citizens won the cup, leaving Manchester United with a bitter after-taste.
That’s great. But why topology?
Although this event seems unpredictable for Manchester United, topology makes a clear separation between the case of this match against Blackburn and confrontations against teams of the same caliber. For example we consider Man-Utd vs West Brom and Man-Utd vs Bolton during the same season.
Let’s try to understand why our match is so special (so you can plan your next trip to the bookies). The first thing we can do is study the space of matches, a match is a point in a space of 14 dimensions (remember each team has 7 features, and a match has 7+7=14 features). We use the two first components of the PCA centered around each of the matches we consider to visualize similar matches.
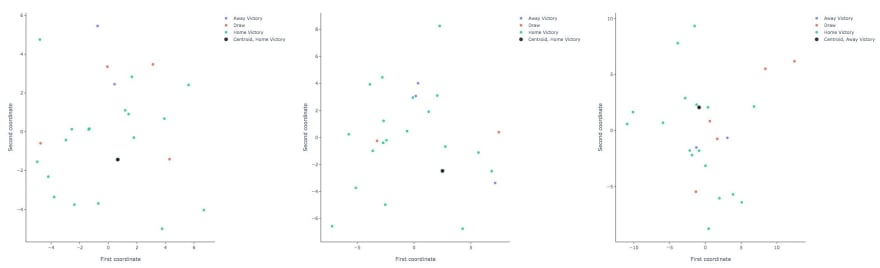
2-dimensional PCA representation for Man-Utd vs West Brom. 3–0, Man-Utd. vs Bolton 2–0 and Man-Utd. vs Blackburn 2–3
What you can’t see with PCA, you can see with TDA
The three plots are projections of the 14 features used to describe the match down to two, and projections are known to loose information along the way. We use TDA to recover and visualize structure from the original space. The tool we use is a persistence diagram (available in Giotto!). A persistence diagram is a representation of the dataset in terms of the connectivity of points, it is obtained by progressively connecting neighbouring points and measuring the homology of the construction. It is a new way to understand, visualize and extract features from data. If you want to learn more about TDA we recommend this post.
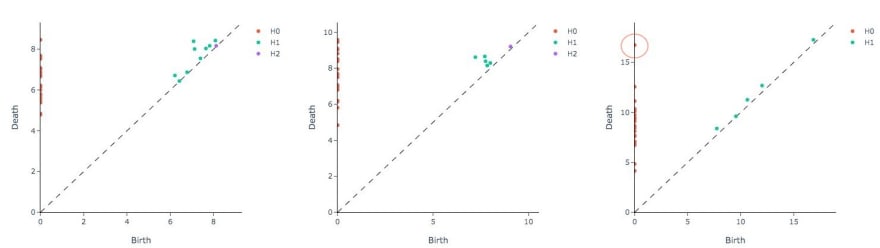
Persistence diagram for Man-Utd vs West Brom. 3–0, Man-Utd. vs Bolton 2–0 and Man-Utd. vs Blackburn 2–3
The three persistence diagrams are computed on the same point clouds as in the case of the PCA. The points in the diagrams are no longer matches, rather they describe relationships between the points in the original space. In our case, it characterises the shape of the point cloud around each of the three selected matches.
The persistence diagrams inform you about local and global structures
From the first two first diagrams, we can see that all the connected components (represented by the orange points) are concentrated on the y-axis between [5,10]. Furthermore, the loops (represented by the green points) are concentrated in the box [6,8]x[6,8] and their maximum distance to y=x is one.
In the last diagram, the orange points are more spread out, the extremal point (0,17) represents a component that is late to connect with the rest of the dataset. On top of that, the green points are also much more spread out on the y=x line, and they are overall way closer to this line.
The structure of the third diagram is suggestive of an outlier
Indeed the orange point (0,17) represents the merge between Man. Utd.-Blackburn with the rest of the matches, this means that this match is further away than it is represented in the PCA diagram.

Persistence diagrams are great, however they cannot be directly inputed in a predictive model. You will need to know how to convert a persistence diagram into a feature for a model.
We use a trick called the amplitude function to synthesise the information in the diagram.
A more detailed explanation of how we extracted features from persistence diagrams is also contained in the Python Jupyter Notebook we are sharing.
Results
The model for individual matches is trained: we are now ready to run some simulations for the whole season. You can choose a squad and see how far they go. As a test for the model, we studied the impact of transferring Messi in every Premier League team.
No surprise, hiring Messi is always good.
With Messi on your squad, your chances to be relegated drops by 12% on average, the probability to bring the trophy home increases by 4% on average, and making it to the top4 increases by 14%. The team in the most need of Messi is Queen’s Park Rangers, who would climb 11 positions in the leaderboard. Originally finishing 14th, with an simulated probability of 72%, Leicester City would qualify for the Champions League.
Below is the original leaderboard for season 14–15, paired with the simulated probabilities for:
-winning the title,
-getting in the top4,
-and being relegated,
with and without Messi in each squad.
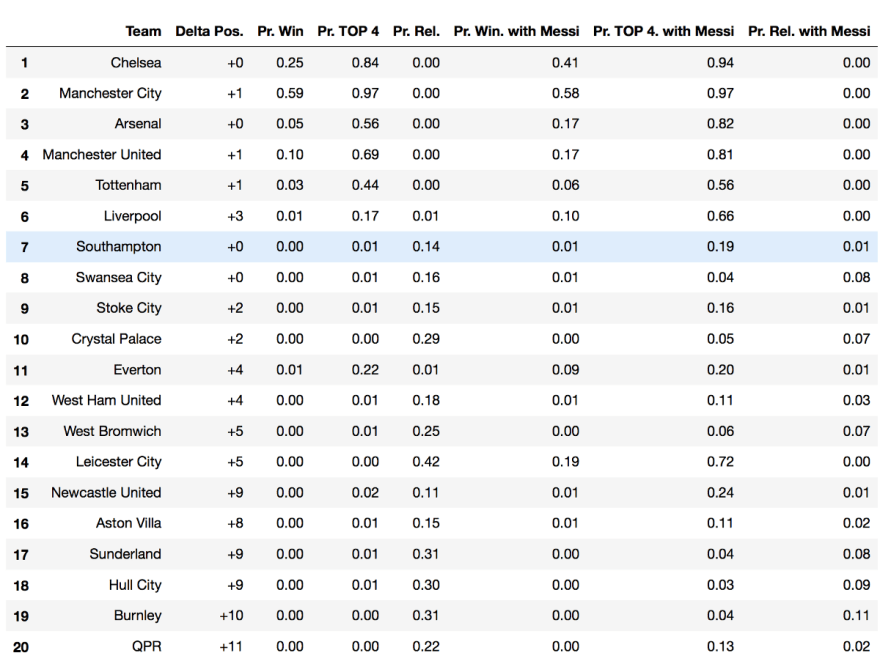
Leaderboard for Premier League season 14–15, including simulated probabilities with and without Messi
Model evaluation
The quality of the leaderboard simulation directly reflects the model’s accuracy in predicting match outcomes. We use a random forest classifier on the 14 features + features from the persistence diagram and we test the framework against some baseline prediction strategies:
- Predicting the home team to win always (baseline)
- Elo rating computed on team’s performance
- Market predictions given by betting odds
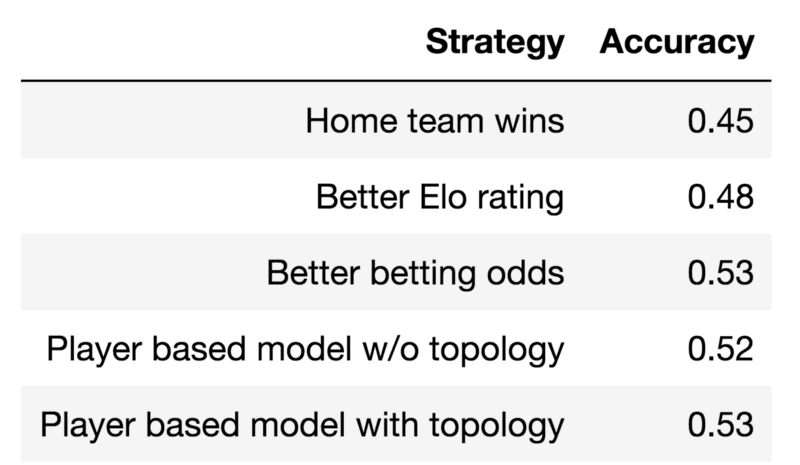 Accuracy of predictive strategies on 14–15 season
In the above table, we present the accuracy of each stragegy on the test set. Below we compare the predictions in terms of their confusion matrices.
Accuracy of predictive strategies on 14–15 season
In the above table, we present the accuracy of each stragegy on the test set. Below we compare the predictions in terms of their confusion matrices.
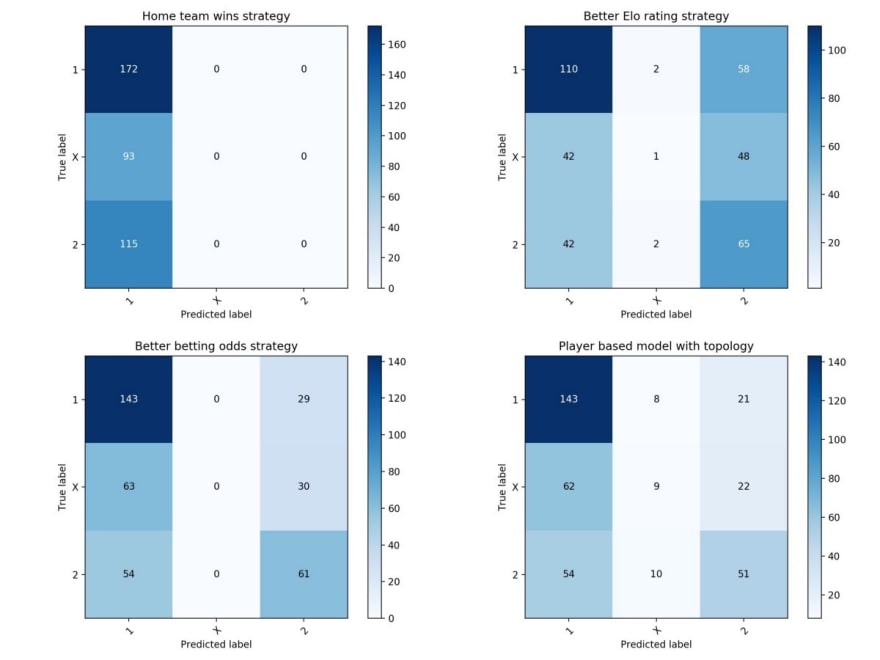 Confusion matrix of the different predictive strategies
The results confirm: football is random. Even the bookie betting odds correctly nail it only for 53% of the matches.
Our results are comparable to those given by the betting odds, with which there is a surprisingly strong correlation. The result is interesting since our model relies on over-simplistic data. Our model has the uncommon capacity to predict draws (which represent 27% of the outcomes).
The model generalizes well when presented with data from other years and other championships. Without having ever “seen” an Italian match, the same model performed at 52% rate of accuracy in predicting Serie A matches of the season 2015/2016. This would not be possible for team-specific strategies like the Elo rating.
Maybe the best attribute of the model is its flexibility in building and testing squads. Not only can we mix teams and simulate championships, we can also make smart transfer decisions. For a fixed budget, you can optimize the best portfolio of players based on their costs and benefits.

Lionel Messi is playing in Barcelona since 2011, maybe it’s time for him to join other teams at least virtually…(source:https://metro.co.uk)
Conclusion
Our attempt is to give a simple solution to a complicated ternary classification problem. The topological model achieves nice accuracy on a very limited set of features, and it is comparable to common, although less flexible approaches.
We have tried it with Messi, now we’re curious, will Ronaldo perform better?


Top comments (0)