A few weeks ago I delivered a session in AngularConnect conference about profiling Angular apps. As part of the talk, I explained shortly what is a memory leak and what can cause memory leaks in Angular apps (ahhm… I’m looking at you observables…).
In this post I’ll cover how you can monitor and find JavaScript memory leaks using Chrome browser tools.
Note: Finding memory leaks is a long process that can take some time. Don’t be afraid to walk this path cause the gain, which is app stability, is very high.
My Memory isn’t What It Used to Be
A memory leak is defined as memory that isn’t required by an app, but isn’t returned to the pool of free memory. When there is a severe memory leak in an app, the app will start being sluggish and it’s performance will degrade over time. App crashes can also occur if the app will be out of memory. Most of the time memory leaks are unnoticed and only if you monitor your app regularly you will be able to understand that there is a memory leak. If the app memory consumption is going up during time and never goes down this is indication that you aren’t releasing memory and that you need to investigate what is the cause for this increasing in memory.
Like most of the programming languages JavaScript can also have memory leaks. In JavaScript there are some options that can cause that:
- Accidental global variables — When you define global variables they get stuck in memory until you refresh the app. This problem is easily solved with the usage of ‘use strict’; or using JavaScript Linters.
- Forgotten timers or callbacks — when you forget to clear an interval you used or you set some callbacks and forgetting to remove them it causes them to stay in memory.
- Out of DOM references — when you remove DOM nodes, but those nodes are still retaining in memory cause there is a reference to them.
- Closures — every closure you create is holding some data in memory and that data is freed only when you dispose the closure which is referencing the data.
Just knowing these options isn’t sufficient, but it can help you later on when you monitor your app and search for leaks.
So, how do we monitor our memory in JavaScript?
Monitoring Your Memory Using Chrome DevTools
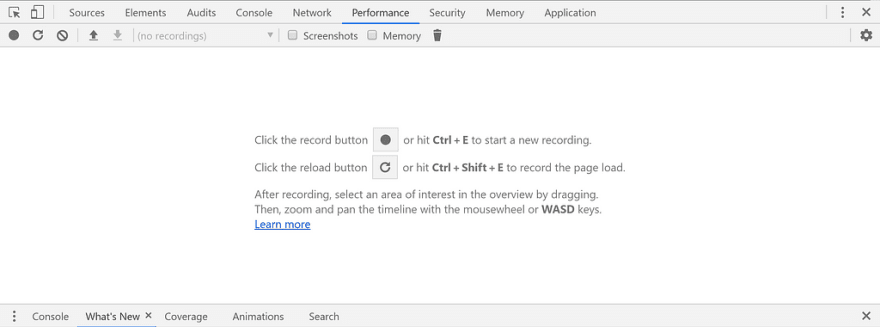
There are a few ways to monitor your app using Chrome DevTools and we will explore them together. Let’s start with the Performance Tab. In the Performance Tab you can find the memory checkbox in the tab’s header menu:
Once you check the memory checkbox you can record your work in the app during some operations and in the recording output you will be able to see the memory consumption during that time. Here is an example of a recording with all memory data shown in the Chrome DevTools:

As you can see there are a lot of details in the timeline. For example you can see that between 0–~6.5 seconds the memory consumption was high and after that time period some memory was released and the heap got cleaned a little bit. How do I know that? you look at the blue line that indicates the JS Heap and you see that in the first 6 seconds it was very high and after that it dropped drastically. The JS Heap indicates allocations in the heap made by JavaScript. When you have memory leaks the blue line of the JS Heap will remain high during time and won’t go down. Another thing to look at is the green line which indicates the number of HTML Nodes in your documents. In out of DOM references scenarios the green line will increase over time and won’t go down. This will tell you that you might have detached DOM nodes which are still referenced and might indicate that your code is causing a memory leak.
Also, another thing to observe in the timeline is when you see spikes in memory consumption. Memory spikes can be caused by an operation that allocates a lot of memory. That doesn’t indicate that you have memory leak but it might indicate that some operation is very costly in terms of memory consumption and that you should investigate why.
Using the Performance Tab can be very helpful but are there any other ways to monitor our app and to find memory leaks? If I’m asking it means that there is. A second option to find memory problems using Chrome DevTools is the Memory Tab.
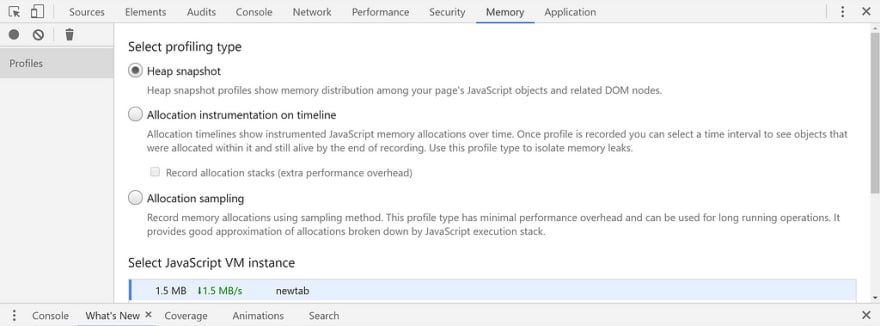
In the Memory Tab you can investigate the memory in more details as opposed to the Performance Tab which can indicate that there are problems. In the Memory Tab you can record heap snapshots, record allocations over time or take allocation sampling. You can even see Heap size which is trending over a few minutes in a dedicated view in the bottom under Select JavaScript VM instance.
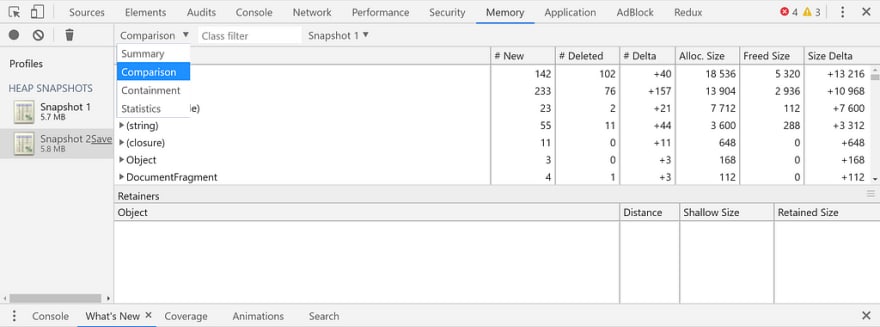
Let’s start with heap snapshots. The idea is to take a heap snapshot and then take another one after a few minutes of work. Once you have the two snapshots, you can compare them and check the changes between the two. You can drill down into the allocated objects and investigate further more.
In the previous figure you can see how to compare snapshots. After you recorded your snapshots (by pressing the record button), you use the dropdown menu to change your views. In the figure you can see that I chose the Comparison view. Once you choose Comparison you will see a comparison grid with a lot of helpful information. For example, how many new objects were added, how many objects were deleted and what is the allocation size for each kind of object. Each node in the grid can be drilled down and opened to see the references in memory. Using the heap snapshots option is very useful if you want to find out of DOM references and Chrome DevTools will even mark those references in red background.
The Allocation instrumentation on timeline option enables you to run a timeline which monitors the allocations over time. What it means is that you start recording and you work in the app and you can see the allocations in realtime:
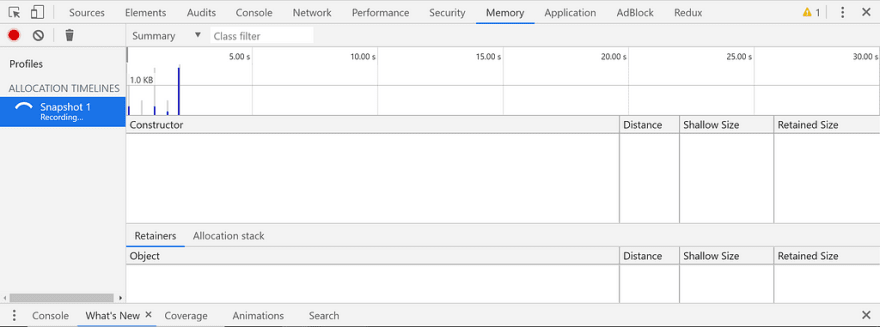
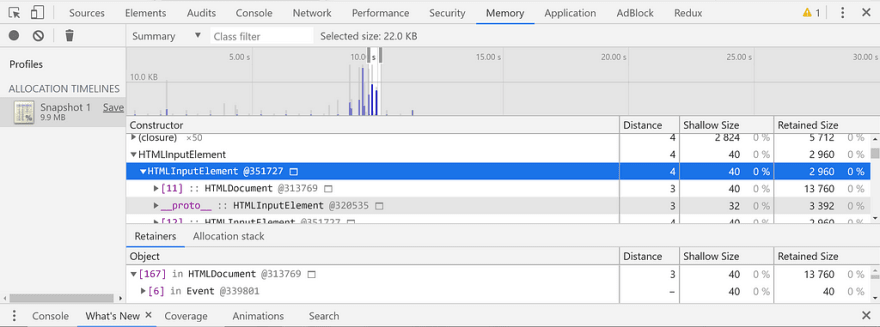
Once you stop the recording you get the allocation information that was gathered. You can drill down into objects and investigate further to see the allocations and their information.
I won’t cover Allocation sampling option, but if you have long running monitoring and you want only sampling and approximations this option might be very useful.
Another option that can be very useful is using the Performance monitor. You can open the Performance monitor by opening the Chrome DevTools settings and then using More tools => Performance monitor like in the next figure:

Once you open the monitor you can get real-time data about the performance of your app over short time. The following figure shows the monitor in action:
You get real-time data about things such as CPU usage, JavaScript heap size, DOM nodes and more. If you search for memory leaks, look at the JS heap size (purple color) and check if it is increases over time.
Chrome Task Manager
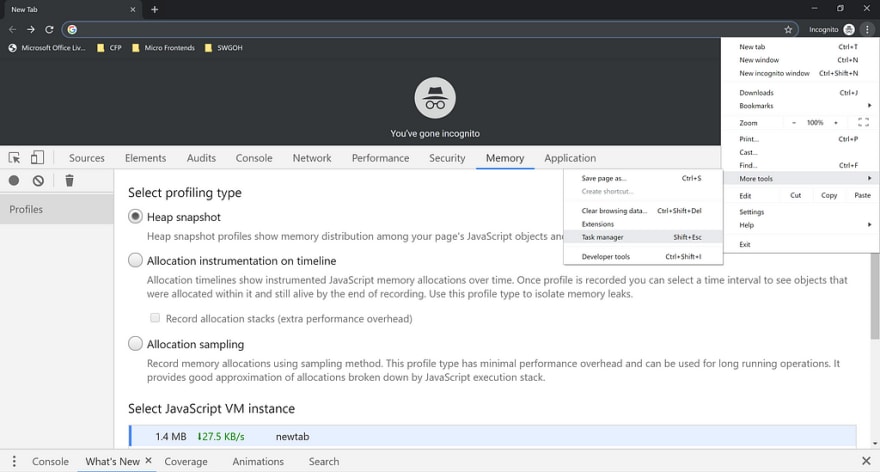
Another tool which isn’t related to Chrome DevTools and can help monitoring your app’s memory is the Chrome Task Manager. The Chrome Task Manager is a real time monitor that monitors all the pages that are currently running. One of the things that it can tell you is how much memory a page is currently using. You can run the Chrome Task Manager by going to More Tools and pressing Task manager (or use Shift+Esc in Chrome):
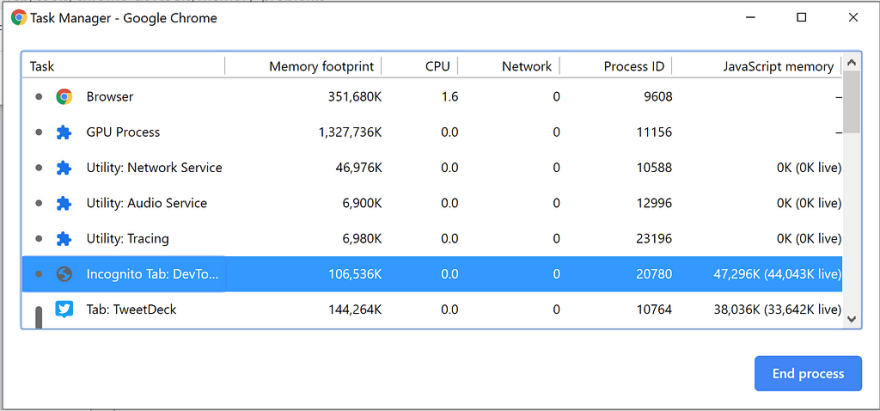
Once the Task Manager is open you can use the right mouse button to open the options menu and check JavaScript memory option:

The JavaScript memory is the memory which is used by the JavaScript Heap while Memory Footprint gives you the entire tab’s memory (including for example HTML Nodes). The interesting value here is marked with parenthesis and it’s the live JavaScript memory which is currently allocated. This value is the current memory that the heap is consuming. You will see it increasing and decreasing during time. If the value only increases over a period of time that means that something is leaking.
Summary
In this post I explained what is a memory leak and how to monitor your app to find memory leaks in JavaScript using Chrome DevTools and Chrome Task Manager. Now it’s your time to be an investigator and try out the things I explained in this post.
If there are other tools you are using in your memory investigations I’ll be happy to hear about them in the comments.



Top comments (0)