Bored to use a lot of console.log() in your Nestjs application?
Want to become more productive and a better coder debugging directly in VSCode to find out what's wrong in your stack trace?
First thing first:
open to VSCode settings, then go to Extensions and then Javascript Debugger.
Find out Auto Attach Filter section and select Always from the dropdown.
Then, create a launch.json file in the .vscode folder of your project, then copy/paste the following code:
{
    "version": "0.2.0",
    "configurations": [
      {
        "type": "node",
        "request": "launch",
        "name": "Debug Nest Framework",
        "runtimeExecutable": "npm",
        "runtimeArgs": [
          "run",
          "start:debug",
          "--",
          "--inspect-brk"
        ],
        "autoAttachChildProcesses": true,
        "restart": true,
        "sourceMaps": true,
        "stopOnEntry": false,
        "console": "integratedTerminal",
      }
    ]
}
It enables debug and console.log() at the same time.
thanks to Sasha Ladnov: https://stackoverflow.com/questions/49504765/debugging-nest-js-application-with-vscode/63325135#63325135
Be sure that in your package.json file there's the debug script:
"scripts": {
    ...
    "start:debug": "nest start --debug --watch",
    ...
}
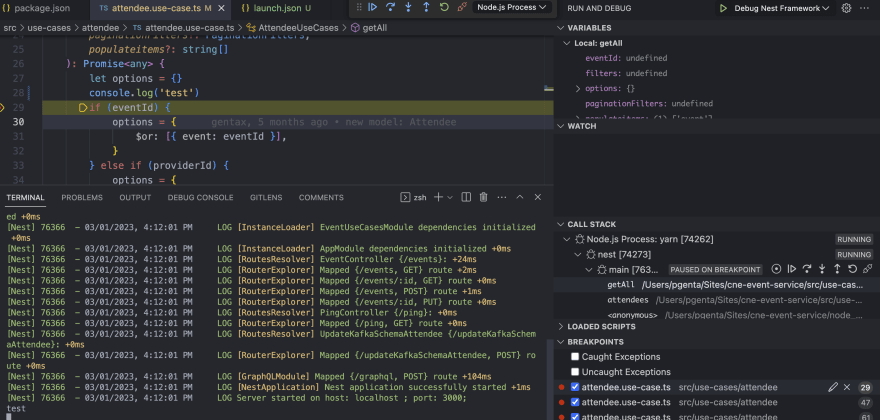
Now you're ready to debug your application!
Type yarn start:debug or npm run start:debug ...
Enjoy!


Top comments (3)
It's important mentioning that "yarn start:debug" or "npm run start:debug" must be run on VSCode terminal, once the Auto Attach Filter depends on it
Thank you, this is helpful
Neat and Concise except "Find out Auto Attach Filter section and select Always from the dropdown."
It is worth mentioning that the option can be found in user settings(ctrl+shift+p)