
Introduction
Prometheus is a systems monitoring and alerting toolkit. It's written in Go, and it was built by Soundcloud and joined Cloud Native Computing Foundation(CNCF) in 2016 as the second hosted project, after Kubernetes. That means it's currently an open-source project, maintained independently of any company. It's an ideal tool for monitoring on-premise solutions as well as cloud workloads.
In Prometheus we talk about Dimensional Data - time series are identified by metric name and a set of key/value pairs:
Metric name: Speed
Label: direction=forward
Sample: 80
Prometheus includes a Flexible Query language. Metric Visualisations can be shown using a built-in expression browser or with integrations like Grafana.
How does Prometheus work?
Prometheus collects metrics from monitored targets by scraping metrics HTTP endpoints.
This is different compared to most of the other monitoring and alerting systems, where metrics are pushed to the tool, or where custom scripts are used to perform checks on particular services and systems.
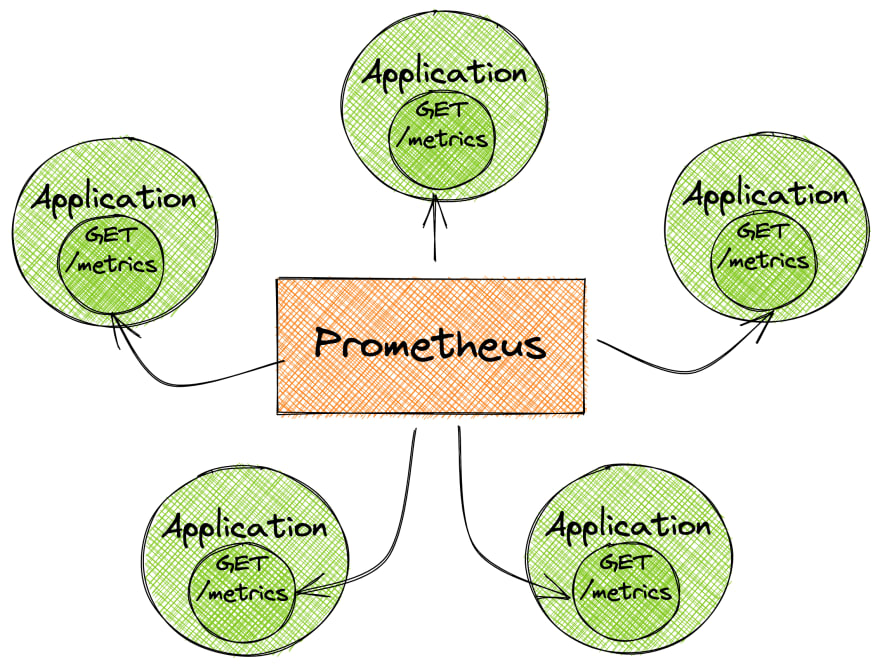
Scraping is also one of the most efficient mechanisms. A single Prometheus server is able to ingest up to one million samples per second as several million time-series.
Basic concepts
All data is stored as a time series which can be identified by the metric name and a set of key-value pairs, called labels.
go_memstat_alloc_bytes{instance="localhost", job="prometheus"} 20
The metric above has two labels: instance and job, and a value of 20.0, which is called a Sample. It can be a float64 value or a millisecond-precision timestamp.
Configuration
The configuration is stored in the Prometheus configuration file in yaml format. The file can be changed and applied without having to restart Prometheus, which can be useful for some scenarios. A reload can be done be executing kill-SIGHUP <pid>.
It's also possible to pass parameters(flags) at startup time to ./prometheus, but those parameters cannot be changed on the fly, so service restart will be required to apply changes here.
The configuration file is passed using the --config.file flag at the start time. The default configuration looks like this:
# my global config
global:
    scrape_interval:    15s # Set the scrape interval to every 15s. Default:60s
    evaluation_interval:15s # Evaluate rules every 15s. Default:60s
    # scrape_timeout is set to the global default (10s).

# Alertmanager configuration
alerting:
    alertmanagers:
    - static_configs:
        - targets:
        # - alertmanager:9093

# Load rules once and periodically evaluate them according to the global `evaluation_interval`.
rule_files:
    # - "first_rules.yml"
    # - "second_rules.yml"
Targets
To scrape metrics we need to add configuration to the Prometheus config file. For example, to scrape metrics from Prometheus itself, the following code block is added by default (it's a part of the default configuration file):
# A scrape configuration containing exactly one endpoint to scrape:
# Here it's Prometheus itself.

scrape_configs:
    # The job name is added as a label `job=<job_name>` to any time-series scraped from this config.
    - job_name = 'prometheus'

        # metrics_path defaults to `/metrics`
        # scheme defaults to `http`.

        static_configs:
        - targets: ['localhost:9090']
Monitoring nodes
To monitor nodes we need to install the node-exported. The node exported will expose machine metrics like CPU and Memory usage of Linux/*Nix machines. It can be used to monitor machines, and later on we can create alerts based on these ingested metrics.
For Windows, we can use a WMI exported
Prometheus Architecture

The main component is Prometheus Server, which is responsible for the retrieval and use of the storage available on the node. We can query the data from the storage using PromQL.
Retrieval happens using Service Discovery which can be DNS, Kubernetes, Consul, etc. Service Discovery is used to find the targets, but they can also be hardcoded.
Prometheus uses Jobs/Exporters to pull its metrics. It can also get metrics from other Prometheus Servers.
For short-lived jobs, we can use a Pushgateway as well. It's not the common use case for using Prometheus but using a Pushgateway, we can also push metrics to Prometheus.
What's more, we can configure alerts for our metrics. For this purpose we have the Alertmanager
We can also consume metrics through the WebUI or external tools like Grafana. There is also an API available for other Clients, so we have endless possibilities to observe the metrics.
Monitoring
Actually, before monitoring code, we should instrument it. Prometheus has a lot of official and unofficial libraries. But even though there is no library for the language we are using, they can be defined in a Simple text-based format.
Ok, but going back to monitoring, we have 4 types of metrics:
Counter - A value that only goes up (e.g. Visits to a website)\
Gauge - Single numeric value that can go up and down(e.g. CPU load, temperature)
Histogram - Samples observations(e.g. request durations or response sizes) and these observations get counted into buckets. Includes(
_count, and_sum). The main purpose is to calculate quantiles.Summary - Similar to a histogram, a summary samples observations(e.g. request durations or response sizes). A summary also provides a total count of observations and a sum of all observed values, it calculates configurable quantiles over a sliding time window.
Pushing metrics
As I said before, by default Prometheus prefers to pull metrics, but sometimes we have a situation where we need to push metrics - because they don't live long enough to be scraped every x seconds. In this case, we can push metrics to Push Gateway

Push Gateway is used as an intermediary service that allows you to push metrics.
Pitfalls:
- Most of the time this is a single instance so this results in a SPOF
- Prometheus's automatic instance health monitoring is not possible
- The Push Gateway never forgets the metrics unless they are deleted via the API
Push Gateway functions:
-
push_to_gateway- replaces metrics with the same grouping key -
pushadd_to_gateway- only replaces metrics with the same name and grouping key -
delete_from_gateway- deletes metrics with the given job and grouping key
Querying
For querying metrics, Prometheus provides an expression language called PromQL. It's a read only language, so we can't insert any data by using it.
There are 4 value types available in Prometheus, which we can execute our queries against:
Instant vector - a set of time series containing a single sample for each time series, all sharing the same timestamp. Example:
node_cpu_seconds_totalRange vector - a set of time series containing a range of data points over time for each time series. Exampe:
node_cpu_seconds_total[5m]Scalar - a simple numeric floating point value. Example:
-3.14String - a simple string value; currently unused. Example:
foobar
Operators
For dealing with the metrics, we also have some operators, which can help us to understand what's going on with the monitored app, and allows us to aggregate and modify metrics to more complex data:
* Arithmetic binary operators
    - `-` (substraction)
    - `*` (multiplication)
    - `/` (division)
    - `%` (modulo)
    - `^` (power/exponentiation)
* Comparision binary operators
    - `==`,`!=`
    - `<`, `<=`, `>=`, `>`
* Logical/set binary operators
    - `and` (intersection)
    - `or` (union)
    - `unless` (complement)
* Aggregation operators
    - `sum` (calculate sum over dimensions)
    - `min` (select minimum over dimensions)
    - `max` (select maximum over dimensions)
    - `avg` (calculate average over dimensions)
    - `stddev` (calculate population standard deviation over dimensions)
    - `stdvar` (calculate population standard variance over dimensions)
    - `count` (count number of elements in the vector)
    - `count_values` (count number of elements with the same value)
    - `bottomk` (smallest k elements by sample value)
    - `topk`(largest k elements by sample value)
    - `quantile` (calculate fi-quantile (0 <= fi <= 1) over dimensions)
Examples
Here are some useful examples of queries, which are using a few operators. I personally find them useful and had a chance to use very similar ones during my work.
up{job="prometheus"}returns timeseriesupwith tagjob=prometheushttp_requests_total{job=~=".*etheus"}returns timeserieshttp_requests_totalwith tagjobmatching regex.*etheus(all values ending with "etheus")http_requests_total{job="prometheus}[5m]returns all the values in the 5m time range. It can't be draw in Prometheus dashboardhttp_requests_total{code!="2.."}returns timeseries where code tag doesn't match2... In this case we filtering out all HTTP 2XX status codes.rate(http_requests_total[5m])per second rate of all timeseries with thehttp_requests_totalname as it's measured over the last 5 minutessum(rate(http_requests_total[5m])) by (job)rate described above but grouped by tagjob
Prometheus Exporters
In Prometheus we have also concept called Prometheus Exporters. They are responsible for exporting all the system statistics like memory usage, CPU, etc. It main purpose is to export Prometheus metrics from existing third-party metrics. Exporters are also used when Prometheus is not able to pull metrics directly(haproxy or linux system stats for example).

We have quite a lot of exporters already available, for example MySQL server exporter, Redis exporter etc.
All available exporters can be found in the official documentation.
To use the exporter we need to add its definition to prometheus.yml file.
Prometheus Alerting
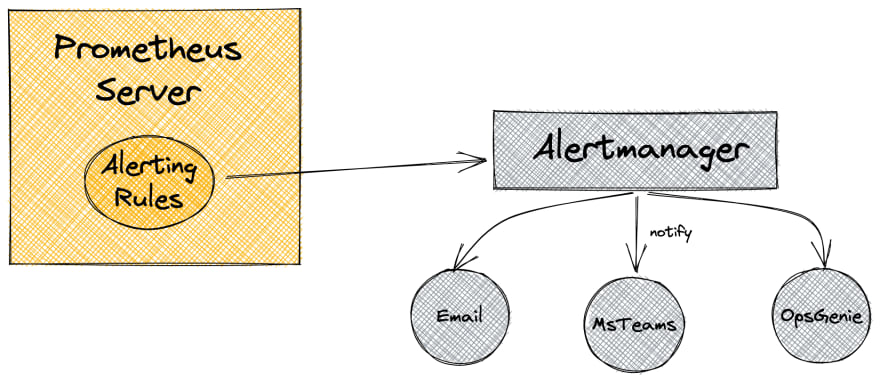
Alerting in Prometheus is separated into 2 parts:
- Alerting rules in Prometheus server
- Alertmanager, which is a separate component.
Alerting rule defines when Prometheus server should put an alert to AlertManager. In the AlertManager we have Routers and Receivers defined. Routes are responsible to fire Receivers(for example email, slack, teams, etc.)
Alerting rules
Rules live in the Prometheus server config. They basically define when we want to alert with some other settings like severity and description. They are sending the alerts being fired to an external service. The best practice is to separate the alerts from the Prometheus config. They can be included in the prometheus.yml file like:
rule_files:
- "/etc/prometheus/alert.rules"
The alert rule format is as follows:
ALERT <alert name>
    IF <expression>
    [ FOR <duration> ]
    [ LABELS <label set> ]
    [ ANNOTATIONS <label set> ]
For example, there we have an alert defined for CPU Usage. This definition fires the critical alert when the machine is under a heavy load of more than 90% for 1 minute:
groups:
- name: example
  rules:
  - alert: cpuUsage
    expr: cpu_percentage > 90
    for: 1m
    labels:
      severity: critical
    annotations:
      summary: Machine under heavy load
Alertmanager
Alertmanager handles the alerts fired by the Prometheus server. It handles deduplication, grouping, and routing of alerts. It also routes alerts to receivers like MS Teams, email, Slack, etc. so we can get notifications if anything goes wrong(when the alert is fired).
The Alertmanager configuration is defined in /etc/alertmanager/alertmanager.yml file. Here is an example:
# The root route with all parameters, which are inherited by the child
# routes if they are not overwritten.
route:
  receiver: 'default-receiver'
  group_wait: 30s
  group_interval: 5m
  repeat_interval: 4h
  group_by: [cluster, alertname]
  # All alerts that do not match the following child routes
  # will remain at the root node and be dispatched to 'default-receiver'.
  routes:
  # All alerts with service=mysql or service=cassandra
  # are dispatched to the database pager.
  - receiver: 'database-pager'
    group_wait: 10s
    matchers:
    - service=~"mysql|cassandra"
  # All alerts with the team=frontend label match this sub-route.
  # They are grouped by product and environment rather than cluster
  # and alertname.
  - receiver: 'frontend-pager'
    group_by: [product, environment]
    matchers:
    - team="frontend"
By default Alertmanager is not installed and we should let the Prometheus instance know about the existence of Alertmanager. To do that we need to alter the prometheus.yml file, by adding the following lines:
# Alertmanager configuration
alerting:
  alertmanagers:
  - static_configs:
    - targets:
      - localhost:9093
Alertmanager supports the concept of grouping similar alerts into 1 notification. So if our application fires an alert about an unprocessed entity 10 times in a period of time, we will receive just one alert saying that the application failed 10 times. It really helps for frequent alerting - without a grouping mechanism, the notification system will be spammed with loads of similar messages.
We can also inhibit other alerts if one specified alert is already fired. If our database is down, we don't need notification about it every minute! Also if we know that we have some maintenance window planned, we can silence the alert for that period.
The alert can be in one of three states:
- Inactive - No rule is met
- Pending - Rule is met but can be suppressed
- Firing - Alert is sent to the configured channel
Summary
I hope after reading this blog post you have more understanding of Prometheus. You know that it can be used for monitoring any application, and alerting if anything goes wrong. You also know what its basic configuration looks like.
If you like it, please leave your comment, add a reaction and share it with your friends on social media. That will encourage me to write more articles like this one. Also please follow me on Twitter to stay in touch, and be updated on every writing I post here. See you next time!


Top comments (0)