Lots of people like to construct dashboards in Grafana, for monitoring and alerting -- it's fast, sleek, and practical. Zebrium is awesome for analytics in-part because we lay everything down into tables in a scale-out MPP relational column store at ingest. Each event type gets its own table with typed columns for the parameters; metrics data is also tabled; ditto for anomalies and incidents.
In our next release, we're rolling out support for Grafana, with Zebrium functioning as a data source. The basic architecture looks like this:

Zebrium's strong data discipline means it can be used as a rich and practical data source for monitoring. We can easily group / join / analyze data through functions and SQL views, and expose such views to Grafana.
As an example, we =, rolled up to the minute and normalized, and call it cpu_basic. It might have these columns, among others:
select ts,host,util from p03_views.cpu_basic limit 10;

ts          |      host       |  util
---------------------+-----------------+-------
 2020-06-18 09:43:00 | ip-172-31-55-34 |  2.44
 2020-06-18 19:54:00 | ip-172-31-55-34 |  1.83
 2020-06-16 19:33:00 | ip-172-31-62-10 |   1.8
 2020-06-18 02:25:00 | ip-172-31-55-34 |  6.07
 2020-06-17 18:16:00 | ip-172-31-62-10 |  3.65
 2020-06-18 11:18:00 | ip-172-31-62-10 |  7.92
 2020-06-16 20:04:00 | ip-172-31-62-10 |  0.48
 2020-06-17 07:05:00 | ip-172-31-62-10 |  5.04
 2020-06-17 08:54:00 | ip-172-31-55-34 | 17.12
 2020-06-18 13:43:00 | ip-172-31-62-10 |  6.95
(10 rows)
Similarly, we might create a simple view in Zebrium to monitor error counts, rolled up to the minute, and call it errors_basic. It might have these columns, among others:
select ts,host,errors from p03_views.errors_basic limit 10;

         ts          |      host       | errors
---------------------+-----------------+--------
 2020-06-18 23:19:00 | ip-172-31-55-34 |      7
 2020-06-18 07:01:00 | ip-172-31-55-34 |      7
 2020-06-18 04:21:00 | ip-172-31-55-34 |      7
 2020-06-15 00:36:00 | ip-172-31-62-10 |     14
 2020-06-17 19:49:00 | ip-172-31-62-10 |     15
 2020-06-15 17:47:00 | ip-172-31-55-34 |      7
 2020-06-16 05:53:00 | ip-172-31-62-10 |     15
 2020-06-18 21:46:00 | ip-172-31-62-10 |     15
 2020-06-16 21:31:00 | ip-172-31-62-10 |     14
 2020-06-17 11:03:00 | ip-172-31-55-34 |      7
(10 rows)
We could define a Grafana variable, host, with the query:
SELECT DISTINCT host FROM p03_views.cpu
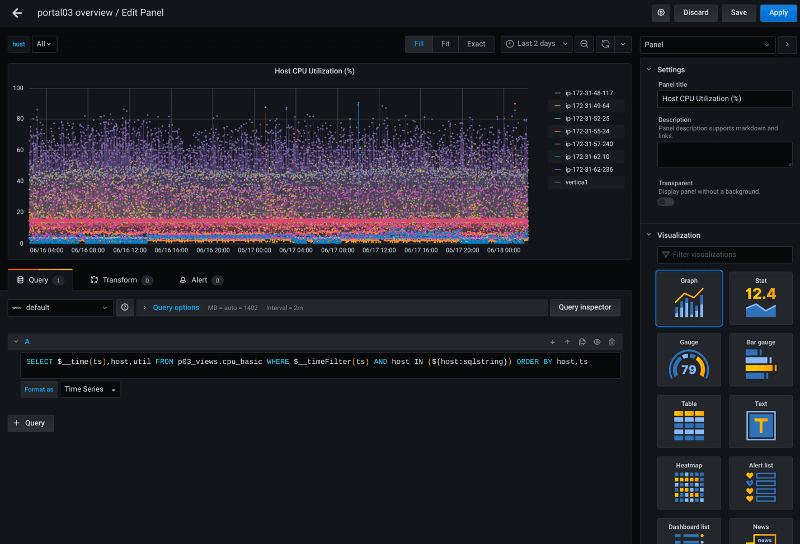
and in a Grafana panel definition for cpu_basic, we could then use the query:
SELECT    $__time(ts),host,util
FROM      p03_views.cpu_basic
WHERE     $__timeFilter(ts)
          AND host IN (${host:sqlstring})
ORDER BY  host,ts
Like so:
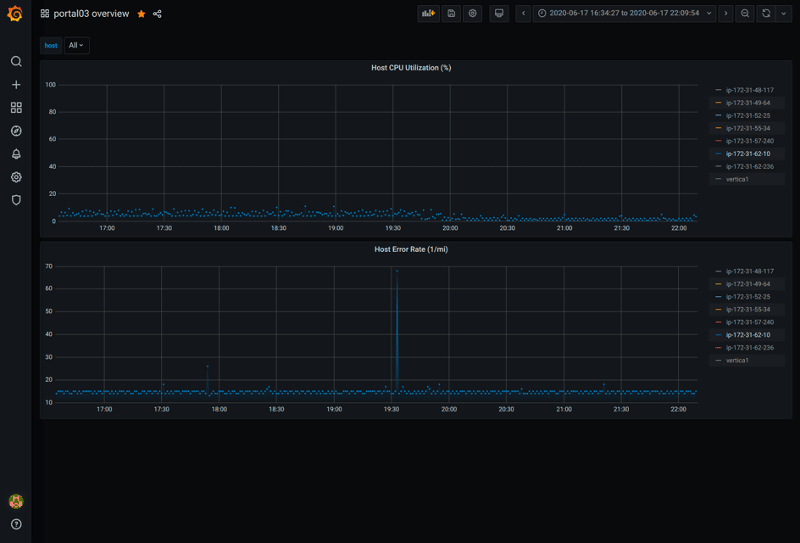
Doing similarly with our errors_basic view and placing both the panels on a dashboard along with a variable multi-selector, we see the beautiful Grafana magic come to life:

where we can zoom in to look at a particular host at a particular point in time, everything functioning the way it usually would in Grafana:
In a follow-on blog, we'll take a closer look at some more complex example views, as well as some more advanced analytics.
Posted with permission of the author:
Larry Lancaster @ Zebrium

Top comments (0)