
By Larry Lancaster @ZebriumLearns (posted with permission)
At Zebrium, we have a saying: “Structure First”. We talk a lot about structuring because it allows us to do amazing things with log data. But most people don’t know what we mean when we say the word “structure”, or why it allows for amazing things like anomaly detection. This is a gentle and intuitive introduction to “structure” as we mean it.
A few years ago I had a vision: if software could structure log files into a database as well as a human could, if it could do this in-line with log generation and keep the schema updated, you would have an amazing platform for building on top of logs.
The goal for Zebrium is simple: understand what’s happening through logs, quickly and automatically. Let’s walk through an explanation of how our unsupervised, in-line machine learning engine structures the data.
A simple example: a log snippet.

The mind structures: there appear to be 4 different “things” here.
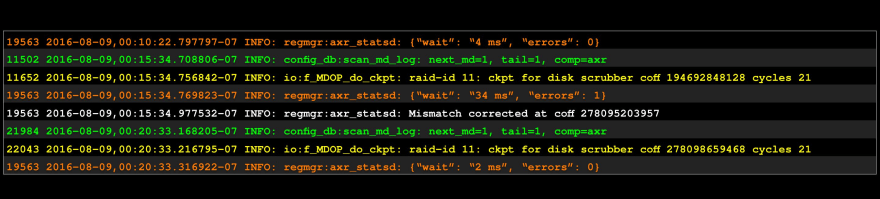
Rearranged: it’s more clear this way.

Even better: we call these 4 chunks etypes (short for “event types”).

It’s typical for log management software to keep a list of well-known prefix formats, and require you to create parsing expressions for others. We don’t do that. Instead, we learn the prefixes associated with a log file or stream ourselves. We’ll try to guess at good names, but you can always override them.
The more exciting part comes next: determining the etype (“event type”) which is made up of a name, structure, and evars (“event variables”). We learn the evar names and types from the body of the event and the prefix.
Let’s step through the above four chunks of log text, one etype at a time:
The first etype: look at those yummy stats in the two rightmost columns. One flavor of anomaly detection is looking for features in timeseries like these. We call the columns, such as “fun” and “wait_ms”, evars.
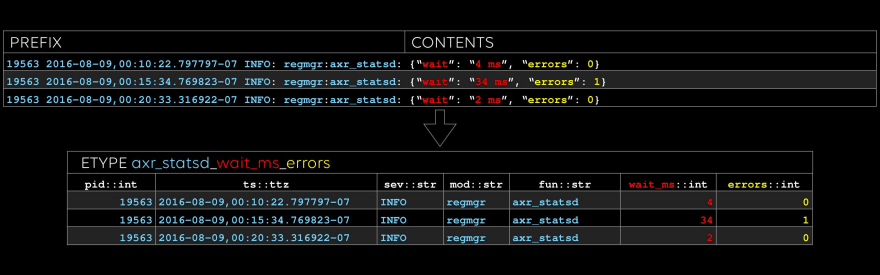
With this level of structure, you know for sure that every number in a timeseries really is the same evar, associated with the same etype. In a future article, we’ll show how we automatically extract dimensions of timeseries metrics and detect anomalies in them.
The second etype: note that we type every evar.
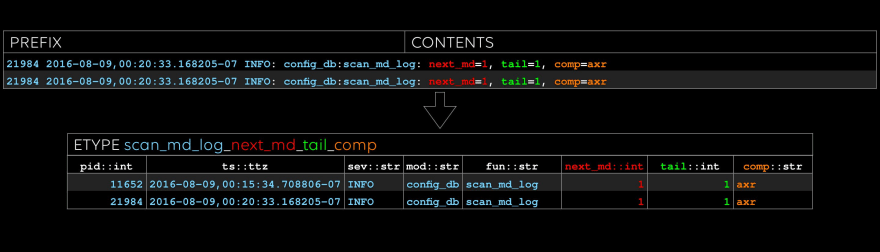
We have notions of simple types such as “float” and “str”, as well as complex types such as file paths and MAC addresses. We plan to allow users to add more.
The third etype: sometimes there are good cues for what to name the evar, like “coff” in this case.
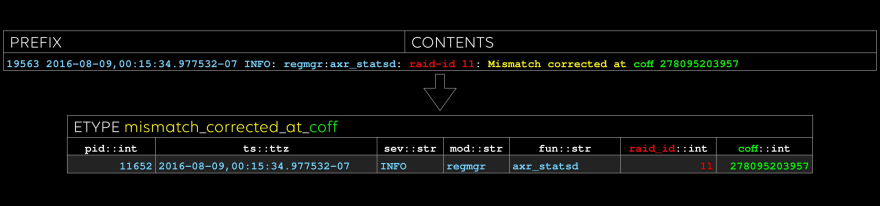
Last one: note that “raid_id” and “coff” occurred in the previous etype, too. We can do efficient inner and outer joins on these columns, treating etypes like tables, if we like.
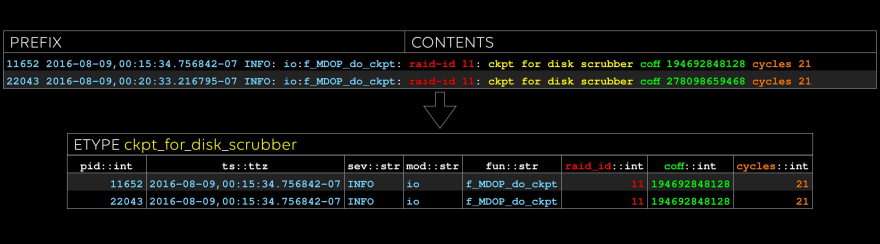
All done: conceptually, an etype is a table, and an evar is a column.
Another type of anomaly detection relates to the sequence of etype occurences; a future article will go into more detail on our anomaly detection analytics. As a super-simple example, though, each etype will happen for the first time exactly once – and that’s clearly an anomaly of some kind, right? Let’s find out.
We run an Atlassian server. As part of testing, one of our engineers decided to log in and shutdown the database behind the Atlassian applications. We then collected all the logs for the previous 19 hours or so to test auto-triage.
During the hour of the test, the syslog generated 113 events:
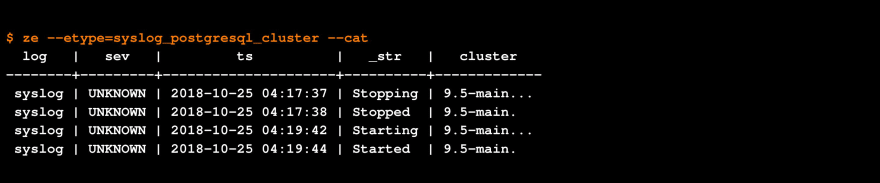
Our API client: query and upload data from the CLI: CSV, JSON, or pretty-print.

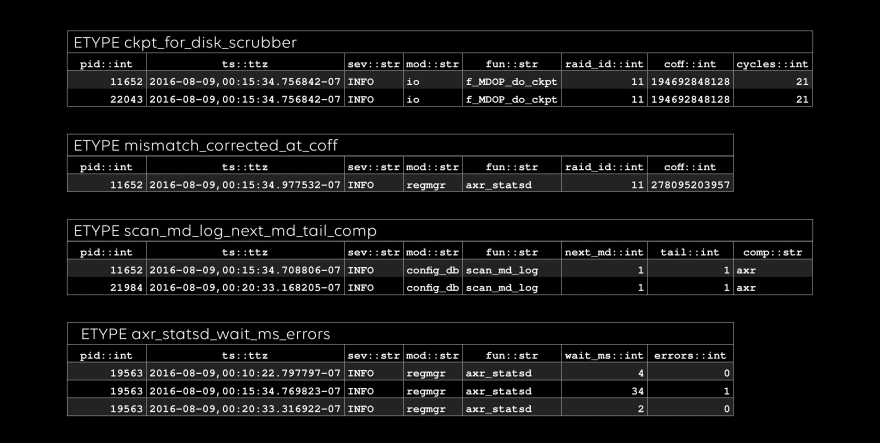
Only two of those events were of etypes that had not been seen before:
Trivial anomaly detection: if something happens for the first time, it might be diagnostic.

So far, so good: our poor-man’s anomaly detection found the relevant two lines, simply because the etypes were new. Now, suppose we wanted to take a look at all the data for one of our anomalous etypes, to better understand it. We provide two ways to interrogate the data for a given etype from a CLI:
The ze API client: let’s keep it simple.
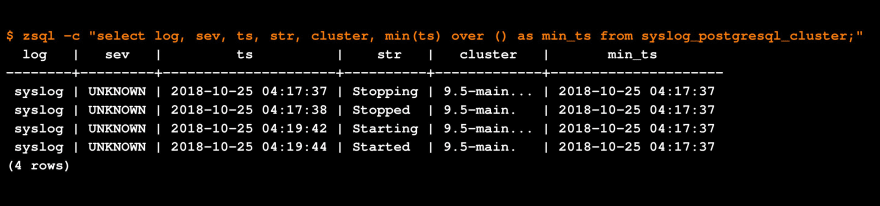
The zsql SQL client: let’s add the timestamp for the first occurrence.
So now we’ve seen how etypes and evars can give you all the basic building blocks you need to start doing anomaly detection, or analytics of any kind, from log data. If you’re interested in our beta program, or just want to get in touch, let us know!


Top comments (0)