
Continuous delivery (CD) in a Kubernetes environment has always been a challenging and daunting task to set up and maintain, but it doesn’t have to be this way. Modern tools can make your application development and deployment process as efficient, quick, and sustainable as possible without requiring a lot of configuration.
Modern tools not only help you with safely getting a new version of your application into production, they also give you the ability to automatically detect and address any problems that arise so you can minimize their impact and provide the best user experience possible.
By the end of this article, you’ll understand the most essential concepts of modern continuous delivery and have a working Kubernetes deployment with a complete continuous delivery workflow—all without having to write a single line of pipeline code.
The CD environment you are going to set up will feature a multi-stage environment with two stages for hardening and production and quality gates that will use Prometheus metrics from your application to check whether the deployment is ready to be promoted into production. The workflow is illustrated in the image below.

Prerequisites
Before you begin, you’ll need the following
- A Kubernetes cluster with at least one node with 4 vCPUs and 16 GB of Memory. To create a GKE cluster suitable for deploying the demo, see the GKE Quickstart of Keptn, the open-source tool that you'll be using in this article.
- The
kubectlcommand line tool installed on your development machine and connected to your cluster. You can find out more about installing kubectl in the official documentation. - The
gitcommand line tool installed to clone a demo application from GitHub.
Step 1: Understand the concepts of modern CD
Before setting up an environment, it's crucial that you are familiar with the most essential concepts regarding modern CD.
Declarative
Most companies today are still building their continuous delivery workflows in an imperative way. Writing and maintaining pipeline code can be very difficult and may lead to a lot of manual work for developers; this is time they can’t use to develop actual software.
A declarative approach however allows developers to define what needs to be done and have the CD tool handle the rest. This not only decreases the time required to write and maintain the configuration, it also benefits developers who are already familiar with defining declarative
configurations using tools like Kubernetes and don’t need to learn complicated tooling.
Scalable
Another essential factor is how easy it is to add new services to your existing pipeline or declaratively defined project and how much effort it is to maintain these different configurations for your services. Organizations often have hundreds of microservices to be managed and deployed in their pipelines.
Most imperative pipelines need a lot of boilerplate code to add new services and can therefore quickly become hard to read and maintain. Declarative definitions on the other hand are easily edited without the need to copy boilerplate code.
Extensible
Many companies already have a preexisting technology stack, including observability tools like Prometheus or test automation such as Jmeter or Neoload and therefore want to reuse their already implemented functionality in their CD workflow. Modern CD tools allow organizations to use existing tools to integrate with their CD workflow and provide a framework for implementing new custom functionality along with existing functionality.
Quality Gates
To ensure the best user experience, applications need a quality check before they can be deployed in a production environment. Quality gates are used to automatically ensure that specifically defined criteria (like response time, error rate, throughput, etc..) are met before deploying your services into production.
These criteria can be declaratively defined using Site-Reliability Engineering (SRE) concepts such as SLIs (service level indicators) and SLOs (service level objectives).
Service-level indicator (SLI)
A service-level indicator is a quantitative measure (metric) of some aspect of your application like response time, error rate or throughput.
Service-level objective (SLO):
A service-level objective defines a certain condition using the SLI that must be met to pass the test. An example of this is a response time on a particular endpoint that needs to remain lower than 200 milliseconds or an error rate that must remain lower than 1%.
Step 2 - Our CD orchestrator of choice: Keptn
Now that you’ve established the essential concepts of modern CD, let's look at an orchestrator that is built upon these concepts and makes them accessible and easy to use.
Keptn is an open-source cloud-native application life-cycle orchestrator and a Cloud Native Computing Foundation (CNCF) project. Keptn uses a declarative approach that allows you to specify DevOps and SRE automation workflows like delivery or operations automation without scripting all the details. The definitions can then be shared across any number of microservices without the need to build individual pipelines and scripts.
Keptn also includes built-in quality gates based on SRE principles such as SLIs and SLOs that help you evaluate and score your defined criteria to decide if a new version is allowed to be promoted to the next deployment stage or if it has to be held back or even rolled back.
Moreover, Keptn provides an excellent integration ecosystem where it translates well-defined cloud events into proprietary vendor APIs. The ecosystem already features many integrations for well-known services like JMeter, LitmusChaos, and Prometheus and allows the user to easily add their own integrations. And thanks to its open-source nature, adding new integrations is possible.
Step 3 - Setting up the platform
Now that you know the essential concepts of modern CD and the advantages that modern CD provides—you’re ready to set up Keptn.
In this section, you will deploy Keptn on your Kubernetes cluster, and connect the cluster to the Keptn CLI (make sure to follow the prerequisites on top of this article).
Before setting up Keptn on your Kubernetes cluster, you first need to decide how you want to expose Keptn. You can complete the setup using an ingress server, as described in this article, or by using any of the other options mentioned in the Keptn documentation.
In this article, you’ll expose via Istio. Therefore, you’ll get started by downloading the Istio installation script from the official website using the following command:
curl -L https://istio.io/downloadIstio | ISTIO_VERSION=1.8.2 sh -
This command will create a folder with the name istio followed by the downloaded version in your current directory. You can execute the installer by running the following command:
./istio-1.8.2/bin/istioctl install
The installer will create all resources needed in your Kubernetes cluster to use Istio including CRD (Custom resource definitions), Configmaps, and more.
Next, you’ll download and install the Keptn CLI that can be used to install and manage Keptn.
If you are using Linux or MacOS you can also install the CLI using the following command:
curl -sL https://get.keptn.sh | KEPTN_VERSION=0.8.0 bash
If you want, you can also manually download the binary file from Github and install the CLI by moving it into your path.
You can now validate the installation using the —help flag:
keptn --help
Keptn consists of a control plane and an execution plane. The control plane allows using Keptn for the quality gates and automated operations use cases while the execution plane adds additional functionality, such as continuous delivery capabilities and services to integrate with testing frameworks such as Jmeter. In this case you will install Keptn by using the continuous-delivery use-case.
keptn install --endpoint-service-type=ClusterIP --use-case=continuous-delivery
The install process usually takes less than 3 minutes and creates all the basic Kubernetes resources needed to run Keptn. You can verify the status using the following command:
kubectl get deployments -n keptn
Once the installation is finished your output should look similar to this:
NAME                                             READY   UP-TO-DATE   AVAILABLE   AGE
api-gateway-nginx                                1/1     1            1           2m44s
api-service                                      1/1     1            1           2m44s
bridge                                           1/1     1            1           2m44s
configuration-service                            1/1     1            1           2m44s
eventbroker-go                                   1/1     1            1           2m44s
gatekeeper-service                               1/1     1            1           2m44s
helm-service                                     1/1     1            1           2m44s
helm-service-continuous-deployment-distributor   1/1     1            1           2m44s
jmeter-service                                   1/1     1            1           2m44s
lighthouse-service                               1/1     1            1           2m44s
mongodb                                          1/1     1            1           2m44s
mongodb-datastore                                1/1     1            1           2m44s
remediation-service                              1/1     1            1           2m44s
shipyard-service                                 1/1     1            1           2m44s
Once Keptn is installed the next step is to configure Istio so that you can access your Keptn instance. Istio is used as the Ingress controller that is responsible for the traffic routing to your cluster.
To make the setup experience as smooth as possible the Keptn team has provided scripts that automatically configure Istio with standard working settings. If you want to customize the setup yourself please take a look at the Keptn documentation.
First you will download the configuration script from Github using curl.
curl -o configure-istio.sh https://raw.githubusercontent.com/keptn/examples/release-0.8.0/istio-configuration/configure-istio.sh
Next, run the configuration script using the following commands:
chmod +x configure-istio.sh
./configure-istio.sh
Now check that the Ingress has been created:
kubectl get ingress -n keptn
The command will output the following:
NAME                HOSTS                  ADDRESS         PORTS   AGE
api-keptn-ingress   ${IP-Address}.nip.io   ${IP-Address}   80      56d
After successfully configuring Istio, you will authenticate your Keptn CLI against the Keptn control-plane you just installed. For that, you need the endpoint of your Keptn API as well as the API token, both of which can be read using kubectl.
KEPTN_ENDPOINT=http://$(kubectl -n keptn get ingress api-keptn-ingress -ojsonpath='{.spec.rules[0].host}')/api
KEPTN_API_TOKEN=$(kubectl get secret keptn-api-token -n keptn -ojsonpath='{.data.keptn-api-token}' | base64 --decode)
This kubectl get command uses the -n flag to set the namespace where the resource is located and the -ojsonpath flag to specify the variable that should be read in the returned output. The values returned by the commands are saved directly to environment variables.
Once the values are stored inside the environment variables the following command can be used to authenticate to the Keptn cluster.
keptn auth --endpoint=$KEPTN_ENDPOINT --api-token=$KEPTN_API_TOKEN
Once the CLI is successfully authenticated with the Keptn cluster you'll receive output similar to:
Starting to authenticate
Successfully authenticated
Step 4 - Create CD resources and deploy the application
Now that you’ve successfully set up Keptn on your Kubernetes cluster, you'll continue by creating a simple HTTP server application and create all the CD resources necessary to deploy the application using Keptn. We’re going to use a demo application provided by the Cloud-Native Computing Foundation (CNCF) that has been built to showcase different deployment/delivery tool capabilities.
First, you’ll clone the project's repository, so you have all the resources needed to start deploying your application on Kubernetes using Keptn.
git clone https://github.com/cncf/podtato-head.git
This command will clone the podtato-head repository from Github and create a folder with the name of podtato-head in your directory. Now you can continue by opening the project in your favorite code editor. You can then find the application in the podtato-server folder of the repository.
The application is already dockerized with a Dockerfile and a bash utility file that helps you push different versions of the Docker images onto a registry.
The registry images will now be used to create the Helm chart that is used to deploy the application on Kubernetes. The Helm chart consists of few files and can be found under delivery>keptn>helm-charts>helloserver.
- Chart.yaml - This file contains all the chart information, including the name, version number, etc.
- values.yaml - This file is used to define the values that you want to inject into your templates.
- Templates - This is the folder where you store the actual manifests that are deployed with the chart. This example only contains a deployment and service file for the application, but it could also include more Kubernetes configurations like configmaps, secrets, etc.
The manifest of the deployment resource looks like this:
apiVersion: apps/v1
kind: Deployment
metadata:
  name: helloservice
  namespace: {{ .Release.Namespace }}
spec:
  replicas: {{ .Values.replicaCount }}
  selector:
    matchLabels:
      app: helloservice
  template:
    metadata:
      labels:
        app: helloservice
    spec:
      terminationGracePeriodSeconds: 5
      containers:
      - name: server
        image: {{ .Values.image}}
        imagePullPolicy: Always
        ports:
        - containerPort: 9000
        env:
        - name: PORT
          value: "9000"
The spec section defines your deployment's desired state containing information like the replica count and information about the created container. Kubernetes then attempts to create the desired state and take action to keep that state if something changes.
The spec.template key defines the rules that Kubernetes will use to create your pod. Here you define the pods deployment's specifics like the image name, pull policy, and container ports.
Next, let's look at the Kubernetes service file, which exposes port 9000 of your pod on port 80 of the Kubernetes worker.
apiVersion: v1
kind: Service
metadata:
  name: helloservice
  namespace: {{ .Release.Namespace }}
spec:
  selector:
    app: helloservice
  ports:
  - name: http
    port: 80
    protocol: TCP
    targetPort: 9000
  type: ClusterIP
Now that all the Helm and Kubernetes resources are defined, you can continue by creating a Keptn shipyard definition. The shipyard defines a task sequence for the delivery of your application. It can hold multiple dedicated stages, each with a different deployment-, test- and remediation strategy.
Thanks to the shipyard declarative approach, there is no need to write any imperative pipeline code.
apiVersion: "spec.keptn.sh/0.2.0"
kind: "Shipyard"
metadata:
  name: "shipyard-sockshop"
spec:
  stages:
    - name: "hardening"
      sequences:
        - name: "delivery"
          tasks:
            - name: "deployment"
              properties:
                deploymentstrategy: "blue_green_service"
            - name: "test"
              properties:
                teststrategy: "performance"
            - name: "evaluation"
            - name: "release"
    - name: "production"
      sequences:
        - name: "delivery"
          triggeredOn:
            - event: "hardening.delivery.finished"
          tasks:
            - name: "deployment"
              properties:
                deploymentstrategy: "blue_green_service"
            - name: "release"
According to the file, you are going to create a multi-stage environment with a hardening and a production stage. Keptn performs a blue/green deployment (i.e., two deployments simultaneously with routing of traffic to only one deployment) and triggers a performance test in the hardening stage. Once the tests complete successfully, the deployment moves into the production stage using another blue/green deployment. Note that the tooling definition (such as which testing tool is executing the tests) is not part of the shipyard file; this is defined as part of the Keptn uniform. In this example, you will use the standard tooling that comes with the default Keptn installation.
Now that you’ve defined the shipyard file, it is time to create your first Keptn project using the following command:
cd podtato-head/delivery/keptn

keptn create project pod-tato-head --shipyard=./shipyard.yaml
After the project is created, you can continue by onboarding helloserver as a service to your project using the keptn onboard service command and passing the project you want to onboard the service to as well as the Helm chart of the service.
keptn onboard service helloservice --project="pod-tato-head" --chart=helm-charts/helloserver
You can now take a look at the project you just created using the Keptn's Bridge, which is the UI of Keptn. You can find the generated access credentials using the following command:
keptn configure bridge --output
Now use the credentials and the URL of the following command to access the Keptn's Bridge.
echo http://$(kubectl -n keptn get ingress api-keptn-ingress -ojsonpath='{.spec.rules[0].host}')/bridge
Once you have successfully signed into the account you should see the following UI.

Now that you have created a project and onboarded a service you can continue by deploying your first artifact using the keptn trigger delivery command:
keptn trigger delivery --project="pod-tato-head" --service=helloservice --image="gabrieltanner/hello-server" --tag=v0.1.1
Here you need to provide the project and service name as well as the image you want to deploy as your artifact.
After deploying you can go back to the Keptn Bridge to see the event that has been generated for your artifact.
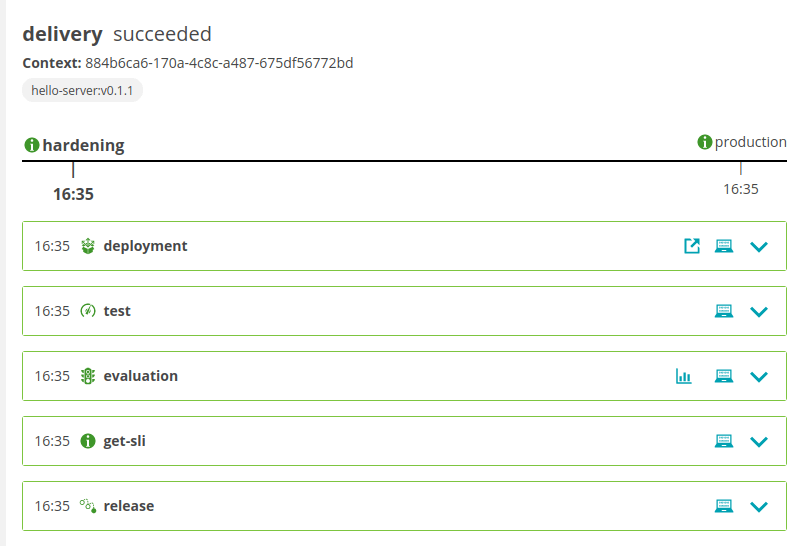
You can also verify the status of your pods using the following command:
kubectl get pods --all-namespaces | grep helloservice
This usually takes a couple of minutes, so just refresh until your output reflects something like the following:
pod-tato-head-hardening    helloservice-primary-5f779966f9-vjjh4                        2/2     Running   0          4m55s
pod-tato-head-production   helloservice-primary-5f779966f9-kbhz5                        2/2     Running   0          2m52s
Once the pods are running you can view your service using the URL you get from the following command or visit it over the Keptn Bridge.
echo http://helloservice.pod-tato-head-hardening.$(kubectl -n keptn get ingress api-keptn-ingress -ojsonpath='{.spec.rules[0].host}')
You should than see a page similar to this:
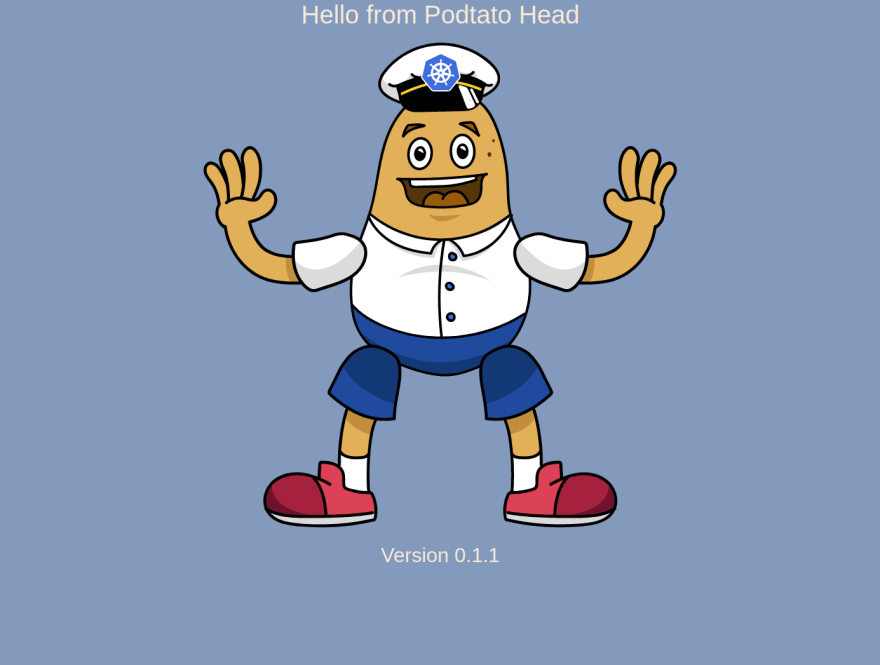
You have now successfully deployed your first service on Keptn in a multi-stage delivery without writing a single line of pipeline code. Next, you will add Quality Gates to your project to automatically ensure that specific defined criteria are met before deploying the service into production.
Step 5 – Add quality gates to CD
Now that you’ve successfully deployed your application on Kubernetes using Keptn it’s time to add quality gate functionality to ensure that your application is working correctly before it’s deployed to production.
The application already exposes the following custom Prometheus metrics:
-
http_requests_total- Total number of HTTP request on each site -
http_server_request_duration_seconds_sum- Sum of the duration of all HTTP request for each page -
go_routines- The number of currently running Goroutines -
request throughput- The throughput is the number of requests that are successfully executed per time unit
These metrics can now be used to define custom metrics in your SLI file using Prometheus syntax. For example, you define the request_throughput as the sum of successful requests (200 status code) in a specific time period specified by the $DURATION_SECONDS environment variable that Keptn automatically sets.
---
spec_version: '1.0'
indicators:
  http_response_time_seconds_main_page_sum: sum(rate(http_server_request_duration_seconds_sum{method="GET",route="/",status_code="200",job="$SERVICE-$PROJECT-$STAGE-canary"}[$DURATION_SECONDS])/rate(http_server_request_duration_seconds_count{method="GET",route="/",status_code="200",job="$SERVICE-$PROJECT-$STAGE-canary"}[$DURATION_SECONDS]))
  http_requests_total_sucess: http_requests_total{status="success"}
  go_routines: go_goroutines{job="$SERVICE-$PROJECT-$STAGE"}
  request_throughput: sum(rate(http_requests_total{status="success"}[$DURATION_SECONDS]))
Next, you can define conditions that your SLIs need to meet in order for the deployment to pass the test and be promoted into the next stage.
The following SLO file holds three objectives:
- The response time on the main page needs to be less than or equal to 1 second.
- The percentage of successful requests must be between 80% and 100%.
- There can be no more than 20 concurrent Goroutines running.
If all three criteria are satisfied, this objective is fulfilled and receives the full score.
---
spec_version: '0.1.0'
comparison:
  compare_with: "single_result"
  include_result_with_score: "pass"
  aggregate_function: avg
objectives:
  - sli: http_response_time_seconds_main_page_sum
    pass:
      - criteria:
          - "<=1"
    warning:
      - criteria:
          - "<=0.5"
  - sli: request_throughput
    pass:
      - criteria:
          - "<=+100%"
          - ">=-80%"
  - sli: go_routines
    pass:
      - criteria:
          - "<=100"
total_score:
  pass: "90%"
  warning: "75%"
Before you can use the SLI and SLO files, you need to configure Prometheus monitoring for your Keptn project. You can install the official Keptn Prometheus service using the following command:
kubectl apply -f https://raw.githubusercontent.com/keptn-contrib/prometheus-service/release-0.4.0/deploy/service.yaml
Next, you’ll set up the Prometheus Alerting Manager rules using the keptn configure monitoring command.
keptn configure monitoring prometheus --project=pod-tato-head --service=helloservice
Prometheus has now automatically set up scrape jobs for your application. Now that you’re scraping the metrics using Prometheus you also need to install the Prometheus SLI service, which will fetch the values for the SLIs referenced in an SLO configuration file during the build evaluation process.
kubectl apply -f https://raw.githubusercontent.com/keptn-contrib/prometheus-sli-service/release-0.3.0/deploy/service.yaml
Now that all services are set up correctly you can add the SLI and SLO files as resources to your Keptn project.
keptn add-resource --project=pod-tato-head --stage=hardening --service=helloservice --resource=prometheus/sli.yaml --resourceUri=prometheus/sli.yaml

keptn add-resource --project=pod-tato-head --stage=hardening --service=helloservice --resource=slo.yaml --resourceUri=slo.yaml
It’s also useful to generate some traffic to the endpoint of your application when running the tests. This can be done using the already defined JMeter files:
keptn add-resource --project=pod-tato-head --stage=hardening --service=helloservice --resource=jmeter/load.jmx --resourceUri=jmeter/load.jmx
keptn add-resource --project=pod-tato-head --stage=hardening --service=helloservice --resource=jmeter/jmeter.conf.yaml --resourceUri=jmeter/jmeter.conf.yaml
When you now deploy the same artifact as before all the tests will be executed before promoting the deployment to the production stage.
keptn trigger delivery --project="pod-tato-head" --service=helloservice --image="gabrieltanner/hello-server" --tag=v0.1.1
After sending the artifact you can see the test results in Keptn Bridge.
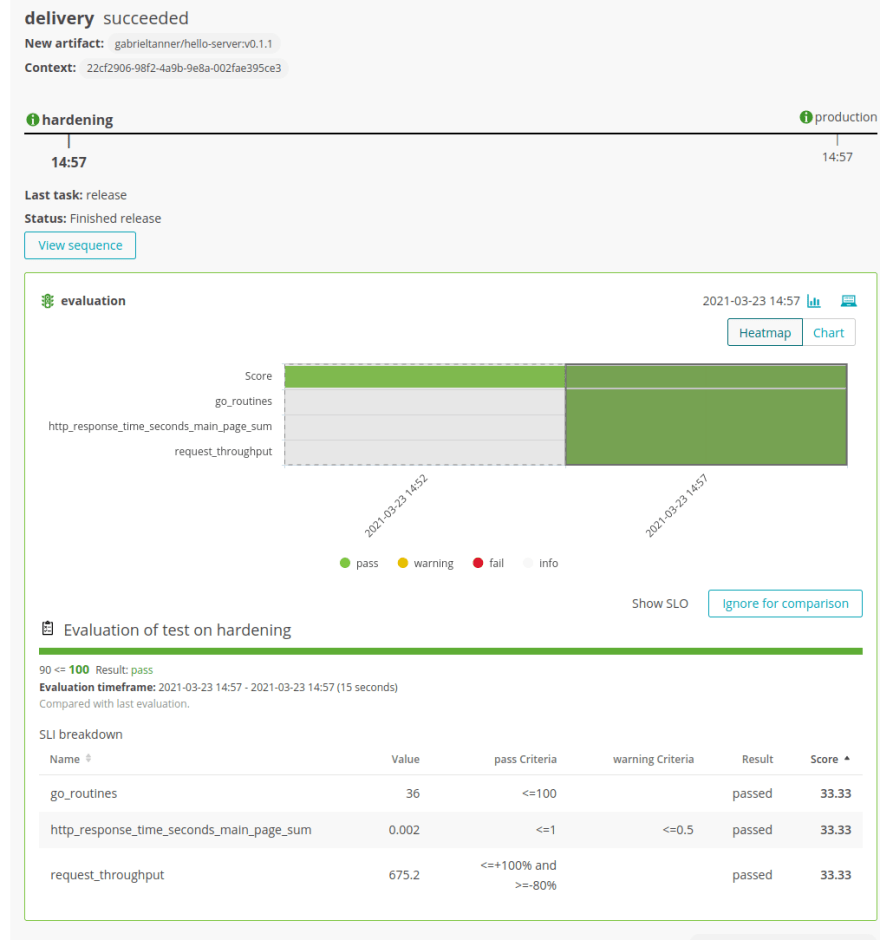
All the test cases defined in the SLO file have passed and the deployment has been promoted to production.
Step 6 – Validate the quality gates
Now that you’re working with quality gates, it’s time to validate that they are working by intentionally deploying a slow build that should fail the success criteria that you defined in the last step. The pod-tato-head application already has a slow build version implemented (v0.1.2) where every request is delayed by 2 seconds.
keptn trigger delivery --project="pod-tato-head" --service=helloservice --image="gabrieltanner/hello-server" --tag=v0.1.2
After sending the artifact you can see the test results in Keptn Bridge.

Here you can see that some of your defined test cases (for example, the response time) failed because you deployed a slow build that is not suitable for production. Once the test fails, the deployment will not be promoted to production and the hardening stage will return to its original state.
Conclusion
In this article, you configured Keptn, deployed your own application, and automatically validated the functionality without writing a single line of pipeline code. You also learned useful terminology and became familiar with the essential concepts of modern CD.
If you’re interested in learning more, consider checking out the official Keptn website or join the Slack community. Also, if you have any questions, feel free to post them in the comments and I will do my best to answer them.


Top comments (0)