
Introducing the Eclipse Performance Monitor
Eclipse IDE (Integrated Development Environment) is a multi-lingual development setting for almost any programming language you could think of – Java, C, C++, Clojure, Groovy, Haskell, JavaScript, Julia, Perl, PHP, Ruby, Rust, and much more. Nonetheless, eclipse is famous for being a dedicated Java IDE
Listed as one amongst the top three Java IDEs, this next-generation IDE is available in both desktop and cloud editions, hence its extensive clientele. But as the saying goes; “To Whom much is given much is expected. With an increasing large user community, the requirement for certain functionality becomes more needful over time.
For a renowned IDE like Eclipse, the feasibility of such serviceability as debugging, performance monitoring, profiling etc., has to be treated with a specific degree of sensitivity. Which is why we would be discussing on how to perform one of the most crucial aspects in the software development life cycle on an eclipse environment – performance monitoring on an Eclipse IDE.
How to Execute Performance Monitoring on An Eclipse IDE
For web artisans who are well-versed in the Java programming language, looking to include distinctive functionalities on the Eclipse IDE, a PDE (Plugin Development Environment) is conveniently available for this. This PDE allows the IDE to flaunt robust tools that aid developers in speeding up the entire development process. Yet, for more in-depth capabilities, it is best to utilize an exclusive eclipse performance monitor viz FusionReactor.
The UI Freeze Monitor
Eclipse IDE is providing an all-inclusive application programming interface. And as earlier mentioned, it comes fully packed with its own performance and profiling toolset in addition to an external plugin additive – all thanks to the PDE. Consequently, before we go into the details of using the dedicated performance tracing facility of the Eclipse IDE, we ought to talk about the interactive UI monitoring tool that comes with the Eclipse IDE. To activate this responsive UI performance measurement feature you would have to navigate to the preference tab on your window. You can do this by following these few steps below.
Steps: –
1 Click on Windows > Preference > UI Responsiveness Monitoring.

2 Once activated, a window would pop on where a stack trace would write to the Errorview, in case there is an occurrence of a UI freeze just like the window below.
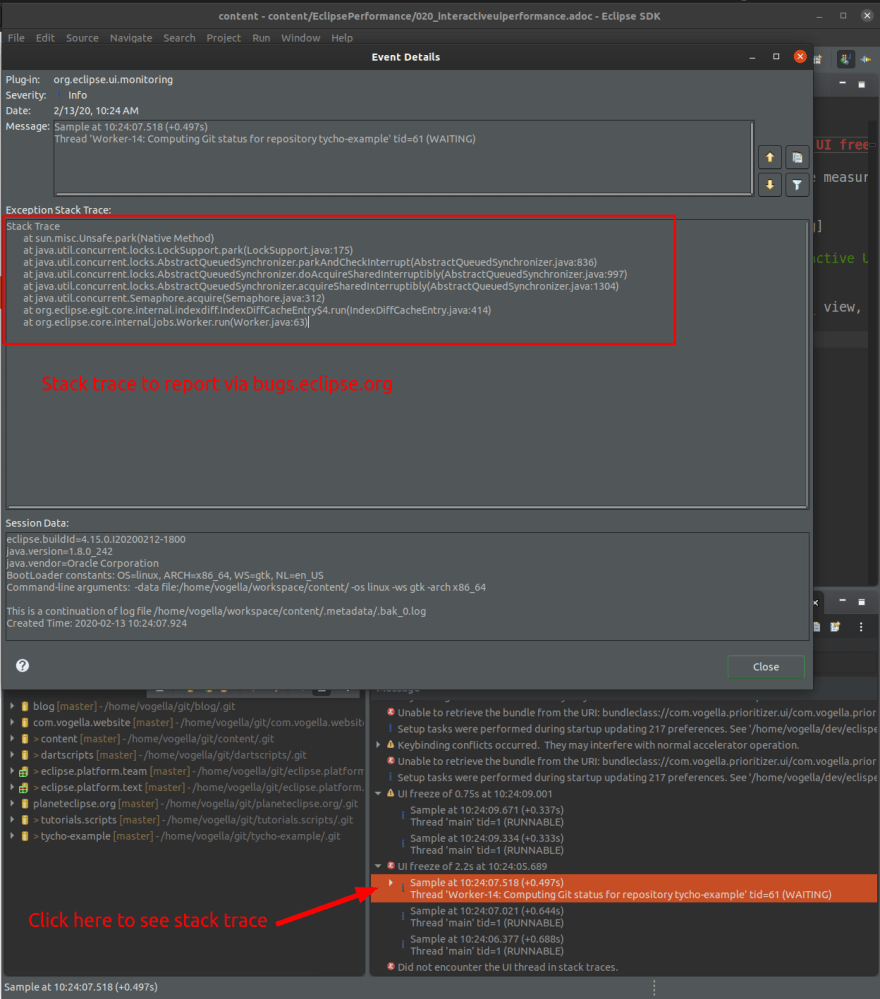
During the event of a deadlock, it is best that you report such freezes https://bugs.eclipse.org/, so that the team can fix these.
For the rest of this guide we would be highlighting on the integrated performance inspecting facilities of Eclipse. Along with steps on how to implement this scrutiny in the most detailed way possible. Let’s immediately get into the nitty-gritty of using a custom-built performance checker.
Utilizing the In-built Tracing Instruments of Eclipse.
The Eclipse IDE proffers a tracing proficiency which can be activated on demand. Upon activation, additional plug-in information is written to the console at runtime. You can activate the native tracing feature through the -debug start parameter. At which time the IDE would search for the .options file in the directory where the installation file for Eclipse is being held up. The file would then be set to the ‘one key=value pair per line’ property.
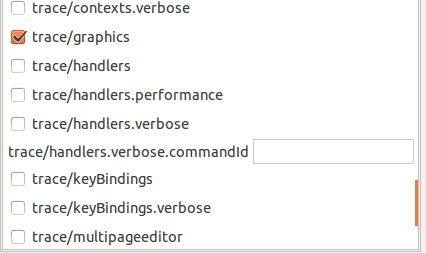
The plugin is designed such that you can see the tracing option in the preference settings by default. It is also possible to initiate this tracking options at runtime. An example of the Eclipse IDE preference is shown in the following screenshot.

These tracing options are also available for a launch configuration. The following examples are going to be slated for specific tracing functions.
Tracing the Start-up Time of Plug-ins
In this example, we would trace the start time of each plug-in during start-up. For this, we would be creating a distinct .options file just like we did in the last instance, but this time with a different content as shown below;

Use the underlisted command to start Eclipse;

The ‘Starting application timestamp’ describes when OSGI (Open Service Gateway Initiative) is done with its activation process. Subsequently, its ‘Application Started’ time reference indicates when the application starts, just as the name imply. After which you extract the information you are most interested in. For instance, the above example is only a small script that extracts the time of the activator of each bundle. Thereafter, sorting every bundle by this time.

Monitoring the Resource Plugin.
The following example uses the same .option file to trace resources.


Implementing Tracking for your Custom Plugin
By means of the Eclipse Tracing API, users can also implement tracing for their custom plugins. To enable users, include their tracing options to the preference page, they would have to turn them on at run time. Using the extension to route to the org.eclipse.ui.trace.traceComponents. See the TracingPreferencePage for more details on how to implement this.
Tracing for Key Binding
The tracing functionality of Eclipse allows one to trace which commands are associated with certain key binding. The following listing contains the trace options to enable that.

Eclipse Sleak
The Sleak monitor tracks the creation and disposal of SWT (Standard Widget Toolkit) graphics resources. You can get this feature directly from SWT Development Tools or install the Eclipse plugin via the SWT Tools Update Sites.
To activate the Sleak functionality, you can use the ‘Tracing’ tab in your Eclipse runtime configuration.

You could also use active this component on the Eclipse IDE. To do this, you would have to start Eclipse with the -debug option from the command line terminal. You would also need to create a .options file in the Eclipse installation directory with the following entries;
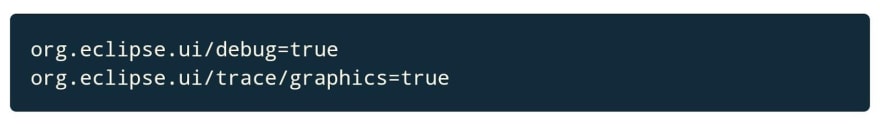
Once you start the Eclipse IDE, you could find the Sleak view under;
Window > Show View > Other… > SWT Tools > Sleak.
Sleak allows you to take snapshots and conveniently creates a difference for comparison. You could click on ‘Stacktrace’ to access the stack trace utility that lets you view where the resource was allocated. Other tools that could be used for Eclipse performance monitoring includes NetBeans profiler, FusionReactor, GC Viewer, VisualVM, JIP, to name a few.
Minimize server downtime
The overall idea of monitoring performance in your Eclipse environment is to ensure you actively minimize server downtime, and speed up the time to resolve the issue. Even though there is an endless list of tools for performance monitoring on a Java development environment such as Eclipse, FusionReactor stands out amidst the crowd. Reason being that FusionReactor outstrips conventional monitoring since it actively tunes the Eclipse IDE, minimizes server downtime and accelerates time to resolution unlike any other Eclipse Performance Monitoring tool obtainable.
Fusion Reactor’s performance monitor comes with a unique package that outclasses many conventional monitoring platforms. It gives you a broad and instant view of what is going on within your Eclipse environment so you can evaluate how much time is needed for each transaction.

Top comments (0)