
Author: lesley@footprint.network
Data Source: USDT Token Dashboard (Only data on Ethereum included)
Token analysis plays a pivotal role in the realm of cryptocurrency and digital assets. It is the process of delving deep into the data and market behaviors associated with these assets. It is a detailed process that involves thoroughly examining price and liquidity connected to these assets.
By analyzing tokens, we gain invaluable insights into market trends, risk factors, trading activities, and the direction of capital flows.
Tether (USDT) is a blockchain-powered platform that enables the seamless use of fiat currencies in a digital format. It is the leading stablecoin in terms of market capitalization, maintaining a fixed value pegged to the U.S. dollar.
How to Analyze USDT?
Token analysis is of paramount importance, and in this context, what are the key metrics to consider?Token Price Analysis: Understanding Market Cap and Price Fluctuations
Using USDT helps to avoid the extreme price fluctuations that often characterize other cryptocurrencies, such as Bitcoin (BTC). USDT is a stable option for those looking to bridge the gap between the crypto world and traditional financial systems.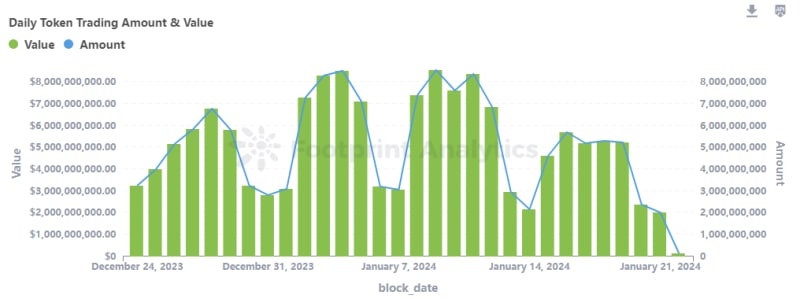 USDT Daily Token Trading Amount & Value
Trading Value Insights: A Diagnostic Tool in Crypto Analytics
The volume of token trades is a key indicator of market activity. Currently, the token's trading volume stands at $18.2B. These trends reflect a decreasing interest or declining activity in the market for USDT tokens. This could be indicative of various factors such as changing market sentiment, investor confidence, or shifts in the overall cryptocurrency market dynamics.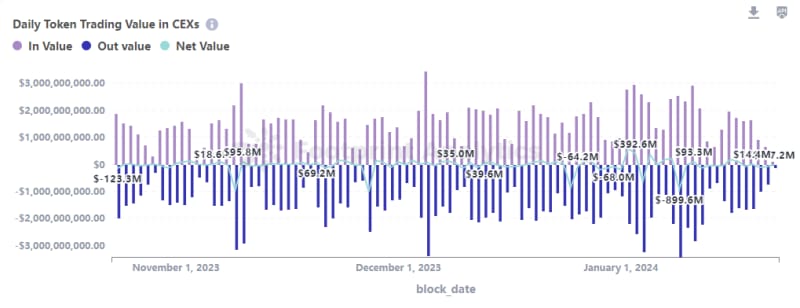 USDT Daily Token Trading Value in CEXs
Net Flow Analysis in CEX: Identifying Trends in Investor Behavior
To gain a deeper understanding of investor behavior, it is essential to analyze the net flow of tokens in and out of centralized exchanges (CEXs). This analysis not only tracks the quantity of tokens moving into and out of exchanges but also examines the broader implications of these movements in relation to market trends, investor confidence, and liquidity.Track the Data of USDT with Footprint
Footprint Token Analysis Page can assist in analyzing additional metrics.You can access all the data you need in Token Dashboard on the Footprint research page.
What's more, you can also perform highly customized analyses using Footprint's versatile features. Here are the key advantages:
- Rich Reference Data: The platform provides extensive reference data, enabling users to gain a deeper understanding of various aspects of cryptocurrencies. This wealth of information aids in making informed investment and trading decisions.
- Versatile Data Access: Users can access data in various ways, including APIs, dashboards, and batch downloads. This flexibility caters to different user preferences and needs, whether they are developers or non-technical users.
- Multi-Dimensional Data: The platform offers data across multiple dimensions and levels, allowing users to conduct detailed drill-down analyses. This hierarchical data structure empowers users to gain comprehensive insights into the cryptocurrency market.
Token analysis is crucial as it provides insights into market trends and risks, aiding investors and traders in making informed decisions. It serves as a compass in the volatile cryptocurrency landscape, helping navigate opportunities and threats.
Check our website or schedule a meeting to know more about the solution.
Footprint Analytics is a blockchain data solutions provider. It leverages cutting-edge AI technology to help analysts, builders, and investors turn blockchain data and combine Web2 data into insights with accessible visualization tools and a powerful multi-chain API across 30+ chains for NFTs, GameFi, and DeFi.
Product Highlights:
- Data API for developers.
- Footprint Growth Analytics (FGA) for GameFi projects.
- Batch download for big-size data fetch.
- View the data dictionary to explore all data sets Footprint provides.
- Check our X post (Footprint_Data) for more product updates.


Top comments (0)