
Author: Lewis King
Date: August 8, 2019
Originally published on the Fauna blog.
As a product manager at Fauna, it’s been important to understand what’s emerging in the wider technology ecosystem. Fauna is a database company that is shaking up the industry by focusing on developers first. With our recently released GraphQL API, we continue to innovate in ways that matter to our tech-savvy community.
I was recently asked by one of our executives, “how can we validate our assumption that serverless architecture is a growing trend?” This is an open-ended question with no single answer. After cracking a smile and dusting off my analyst hat, I decided I’d do some digging. And I’m excited to teach you how to do this very digging yourself with the following tutorial!
What’s a proxy for actual tech activity, not just noise?
My first thought was to check Twitter. Unfortunately, Twitter now provides access to its “Firehose” of tweets only through a paid option. Third-party research firms also offer hashtag analysis at a hefty premium.
As a sort-of-developer and a long time data analyst, I knew that Stack Overflow (SO) questions and GitHub repos point to the truth over buzzwords. With these two sources, I hit the jackpot. I decided to look for the number of SO questions and GitHub repos over time to gauge the popularity of the serverless architecture.
But “how do I query these sources?” you ask
Much to my delight, both Stack Overflow and GitHub provide access to their data for free and public use. Thanks, Stack Overflow and GitHub!
Stack Overflow
Stack Overflow offers their own Data Explorer. It’s bare bones, and works perfectly for simple queries. I recommend spending some time taking a look at their popular queries--some have over 100,000 views!
The query I wrote to analyze the number of SO questions over time:
select
  concat(datepart(year, CreationDate),'-', datepart(month, CreationDate)) as dt,
  count(1) num_serverless_mentions
from
  Posts
where
  Title LIKE '%serverless%'
group by
  concat(datepart(year, CreationDate),'-', datepart(month, CreationDate))
Let’s dissect what this query is doing:
- The concat() function turns “
CreationDate” into a YYYY-MM date format that Google Sheets can easily turn into a time series graph -
count(1)counts each record in the Posts table that matches our conditions -
Title LIKE '%serverless%'locates all of the different posts with serverless anywhere in the post title ---- Replace serverless with any interesting tech trend or language to perform your own analysis 😸 - The group by clause ensures that all posts are counted, in monthly buckets
The resulting data is visualized here:
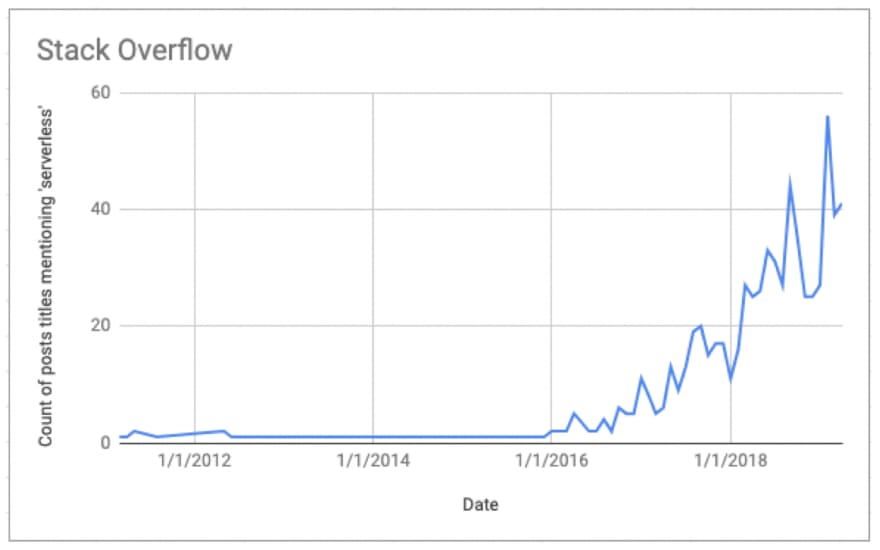
Wow! Just look at that growth over time. Up and to the right we go 🚀
Github
GitHub offers a subset of their data as a free and public dataset on Google BigQuery (note: requires Google login). Tables offered include data about repos, languages, commits, etc.
The query I wrote to analyze the number of GitHub repos over time:
select
    concat(cast(year(created_at) as string),'-',cast(month(created_at) as string)) dt,
    count(1) num_serverless_repos
FROM (TABLE_DATE_RANGE([githubarchive:day.],
    TIMESTAMP('2017-01-01'),
    TIMESTAMP('2019-06-01')
  ))
  where repo.name like '%serverless%'
group by 1
order by 1
A tad more complex! Let’s dissect what this query is doing:
- As in the SO query, the
concat()function turns “created_at” into a YYYY-MM date format that Google Sheets can easily turn into a time series graph. -
FROM (TABLE_DATE_RANGE([githubarchive:day.]... requires some explanation. The way this data is stored in BigQuery is in daily tables. To perform a time series query across days, we need to select a range of tables by date. The TABLE_DATE_RANGE function takes three inputs: the table prefix (i.e. githubarchive:day.), and the start and end dates. ---- Note that BigQuery limits the date range to 1000 days/tables. So performing this analysis across many years requires a UNION between result tables. -
repo.name like '%serverless%'picks out all of the different posts with "serverless" anywhere in the repo name -
group by 1and order by 1 tell the query to organize the query by the date, i.e. the first line in the select statement. The resulting data is visualized here:

Even more up and to the right! Literal 📈
Conclusion
As shown in both charts, serverless is a tech trend that extends beyond being a buzzword. Tens of thousands of repos have been created in the last 3 years with serverless in the title, and the number of Stack Overflow posts continues to grow over time.
This research reaffirms Fauna’s serverless-first approach. Our customers have stated the value clearly: without needing to worry about provisioning and ops, they are able to focus on what they enjoy doing: building meaningful products.
It’s clear that by the start of 2017, serverless architecture was hitting its stride. What tech trends are you interested in investigating, and getting ahead of? I invite you to run my queries using your own keywords, and share the results with me or on our Community Slack channel.


Top comments (0)