
We all love diagrams. A quick peek allows us to quickly create a mental map, no matter whether it's cloud architecture, a database schema, or a sequence diagram.
But creating diagrams is hard. It's hard to keep them up to date, it's hard to collaborate on them, and it's hard to make them look good.
There are a lot of tools for creating diagrams, but probably the most popular one is draw.io. It's a great tool, but it's not without its flaws.
It gives you a lot of freedom, but also bothers you with the little details.
Since we often use diagrams to describe our infrastructure, why don't we learn from the DevOps world and treat them as code?
What if next to our Infrastructure as Code (IaC) we could also have Diagrams as Code (DaC)?
What is D2?
In the words of the creators, D2 is a domain-specific language (DSL) that stands for Declarative Diagramming. Declarative, as in, you describe what you want diagrammed, it generates the image.
In other words, D2 gives you the ability to write diagrams as code, and then use a CLI tool to compile and render them into SVG or PNG images.
The CLI tool supports live reload, so the workflow is nearly as smooth as working with other diagram tools.
Get started with D2
You can install the D2 CLI tools by following the instructions on the D2 website.
After installing the CLI, you should now be good to go. The most important command is:
$ d2 -w input.d2 output.svg
This will run a live reload server that will watch for changes in the input.d2 file and render the output to output.svg.
It will also open a browser window with the rendered diagram. For most cases this is all you need, however it is also worth noting
that you can change the theme of the diagram by passing the --theme/-t parameter. This parameter is the ID of the target theme, which is not
showcased in the D2 docs, but you can find a list of all available themes in the D2 repo.
# Renders with the "Shirley temple" theme
$ d2 -w input.d2 -t 102 output.svg
Creating a diagram with D2
Using D2 to create a diagram is very simple. To present this, we will try to recreate the example AWS architecture diagram from draw.io examples.

We start by defining the containers.
aws_1: AWS Cloud {}

aws_2: AWS Cloud {}
Here, aws_1 and aws_2 are the IDs of the containers. We can then later use those IDs to reference the objects inside (or the containers themselves).
Next, we define the objects inside the containers (and the nested containers).
aws_1: AWS Cloud {
  obj: Object
  bucket_1: Bucket
  bucket_2: Bucket

  subsystem: "" {
    cloudwatch: Amazon CloudWatch
    cloudtrail: Amazon CloudTrail
    sns: Amazon Simple Notification Service
    sqs: Amazon Simple Queue Service
    lambda: AWS Lambda
    kinesis: Amazon Kinesis Data Firehose
    dynamo: Amazon DynamoDB
  }
}

aws_2: AWS Cloud {
  bucket: Bucket

  subsystem: "" {
    cloudwatch: Amazon CloudWatch
    cloudtrail: Amazon CloudTrail
  }
}

We have defined all the objects inside the containers. Now we can make the connections between them.
This is by far the part that is most troublesome when using traditional diagram tools, since with each update of the diagram you have to make sure
that the connections are still clear and correct. In D2, this is a breeze.
aws_1.bucket_1 -> aws_2.bucket
aws_2.subsystem.cloudwatch -> aws_1.subsystem.cloudwatch: Monitor template

aws_1: AWS Cloud {
  obj: Object
  bucket_1: Bucket
  bucket_2: Bucket

  obj -> bucket_1
  bucket_1 -> subsystem.cloudtrail
  subsystem.kinesis -> bucket_2

  subsystem: "" {
    cloudwatch: Amazon CloudWatch
    cloudtrail: Amazon CloudTrail
    sns: Amazon Simple Notification Service
    sqs: Amazon Simple Queue Service
    lambda: AWS Lambda
    kinesis: Amazon Kinesis Data Firehose
    dynamo: Amazon DynamoDB

    cloudtrail -> cloudwatch -> sns -> sqs -> lambda
    lambda -> dynamo
    lambda -> kinesis
  }
}

aws_2: AWS Cloud {
  bucket: Bucket

  bucket -> subsystem.cloudtrail

  subsystem: "" {
    cloudwatch: Amazon CloudWatch
    cloudtrail: Amazon CloudTrail

    cloudtrail -> cloudwatch
  }
}

And that's it! The specified objects are connected automatically. But the diagram still looks a little raw - let's add some icons to make it look better.
aws_1.bucket_1 -> aws_2.bucket
aws_2.subsystem.cloudwatch -> aws_1.subsystem.cloudwatch: Monitor template

aws_1: AWS Cloud {
    obj: Object
    obj.shape: circle
    obj.style.stroke: "#62a638"
    bucket_1: Bucket
    bucket_1.shape: image
    bucket_1.icon: https://raw.githubusercontent.com/exler/diagrams/main/icons/aws/s3/s3.svg
    bucket_2: Bucket
    bucket_2.shape: image
    bucket_2.icon: https://raw.githubusercontent.com/exler/diagrams/main/icons/aws/s3/s3.svg

    obj -> bucket_1
    bucket_1 -> subsystem.cloudtrail
    subsystem.kinesis -> bucket_2

    subsystem: "" {
        cloudwatch: Amazon CloudWatch
        cloudwatch.shape: image
        cloudwatch.icon: https://raw.githubusercontent.com/exler/diagrams/main/icons/aws/cloudwatch/cloudwatch.svg
        cloudtrail: Amazon CloudTrail
        cloudtrail.shape: image
        cloudtrail.icon: https://raw.githubusercontent.com/exler/diagrams/main/icons/aws/cloudtrail/cloudtrail.svg
        sns: Amazon Simple Notification Service
        sns.shape: image
        sns.icon: https://raw.githubusercontent.com/exler/diagrams/main/icons/aws/simple_notification_service/sns.svg
        sqs: Amazon Simple Queue Service
        sqs.shape: image
        sqs.icon: https://raw.githubusercontent.com/exler/diagrams/main/icons/aws/simple_queue_service/sqs.svg
        lambda: AWS Lambda
        lambda.shape: image
        lambda.icon: https://raw.githubusercontent.com/exler/diagrams/main/icons/aws/lambda/lambda.svg
        kinesis: Amazon Kinesis Data Firehose
        kinesis.shape: image
        kinesis.icon: https://raw.githubusercontent.com/exler/diagrams/main/icons/aws/kinesis_data_firehose/firehose.svg
        dynamo: Amazon DynamoDB
        dynamo.shape: image
        dynamo.icon: https://raw.githubusercontent.com/exler/diagrams/main/icons/aws/dynamodb/dynamodb.svg

        cloudtrail -> cloudwatch -> sns -> sqs -> lambda
        lambda -> dynamo
        lambda -> kinesis
    }
}

aws_2: AWS Cloud {
    bucket: Bucket
    bucket.shape: image
    bucket.icon: https://raw.githubusercontent.com/exler/diagrams/main/icons/aws/s3/s3.svg

    bucket -> subsystem.cloudtrail

    subsystem: "" {
        cloudwatch: Amazon CloudWatch
        cloudwatch.shape: image
        cloudwatch.icon: https://raw.githubusercontent.com/exler/diagrams/main/icons/aws/cloudwatch/cloudwatch.svg
        cloudtrail: Amazon CloudTrail
        cloudtrail.shape: image
        cloudtrail.icon: https://raw.githubusercontent.com/exler/diagrams/main/icons/aws/cloudtrail/cloudtrail.svg

        cloudtrail -> cloudwatch
    }
}
With the icons added, the diagram is much more intuitive and easier to understand. Sadly, D2 does not support filesystem paths for icons, so you have to use remote URLs.
Nevertheless, the diagram is finished and looks great.
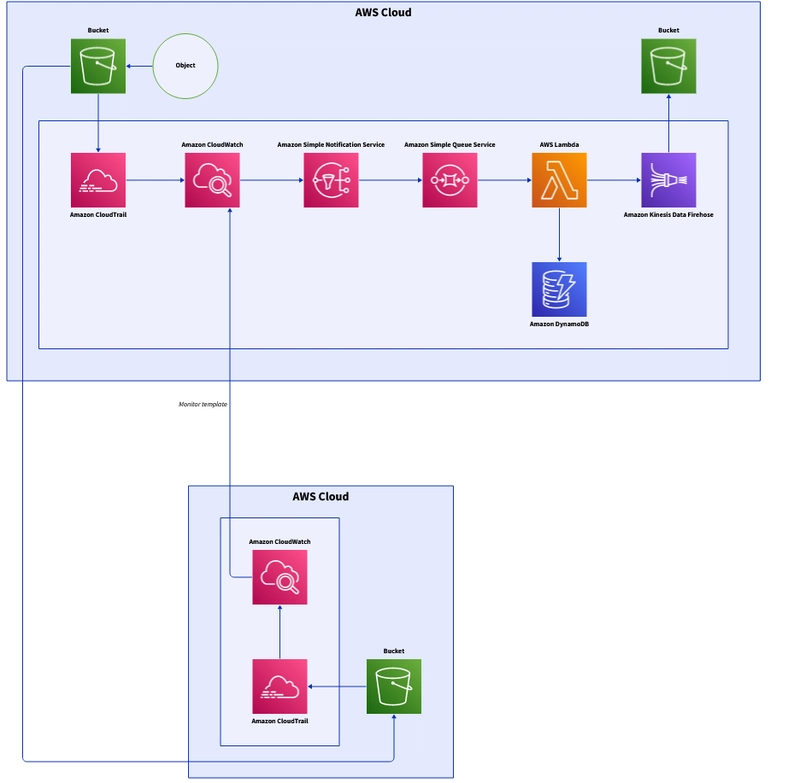
For now, D2 has limited capability of styling, so we are not able to fully reproduce the original diagram. However, we just wrote an easily reproducible and maintainable diagram in less than 70 LOC!
Summary
I hope that this post has convinced you that Diagrams as Code fit the modern's software architect's tech stack perfectly.
They are easy to write, easy to maintain, and easy to share. Give them a go when you have the chance!

Top comments (0)