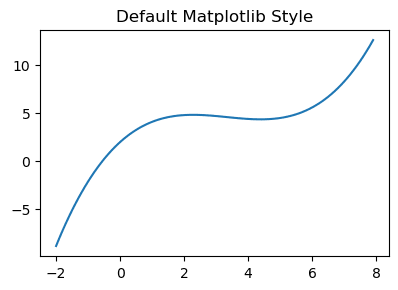
In this post, you’ll learn about the different available matplotlib styles that can instantly change the appearance of the plot. Let’s begin by making a simple line plot using the default style. This simple style is often the first (and sometimes only) style that many people encounter with matplotlib not realizing how easy it is to choose others.
import matplotlib.pyplot as plt
import numpy as np

x = np.arange(-2, 8, .1)
y = .1 \* x \*\* 3 - x \*\* 2 + 3 \* x + 2

fig, ax = plt.subplots(figsize=(4.5, 3), dpi=100)
ax.plot(x, y)
ax.set\_title('Default Matplotlib Style');
Viewing all of the available styles
There are nearly 30 builtin styles to matplotlib that can be activated with the plt.style.use function. The style names are available in the plt.style.available list. In the following code, we iterate through all of the available styles, then make the same line plot as above, setting the style temporarily for each Axes with plt.style.context.
fig = plt.figure(dpi=100, figsize=(10, 20), tight\_layout=True)
available = ['default'] + plt.style.available
for i, style in enumerate(available):
    with plt.style.context(style):
        ax = fig.add\_subplot(10, 3, i + 1)
        ax.plot(x, y)
    ax.set\_title(style)

Showing the style settings
Each style’s settings are stored in the plt.style.library dictionary. Here, we get all of the settings for the seaborn-darkgrid style.
plt.style.library['seaborn-darkgrid']

RcParams({'axes.axisbelow': True,
          'axes.edgecolor': 'white',
          'axes.facecolor': '#EAEAF2',
          'axes.grid': True,
          'axes.labelcolor': '.15',
          'axes.linewidth': 0.0,
          'figure.facecolor': 'white',
          'font.family': ['sans-serif'],
          'font.sans-serif': ['Arial',
                              'Liberation Sans',
                              'DejaVu Sans',
                              'Bitstream Vera Sans',
                              'sans-serif'],
          'grid.color': 'white',
          'grid.linestyle': '-',
          'image.cmap': 'Greys',
          'legend.frameon': False,
          'legend.numpoints': 1,
          'legend.scatterpoints': 1,
          'lines.solid\_capstyle': 'round',
          'text.color': '.15',
          'xtick.color': '.15',
          'xtick.direction': 'out',
          'xtick.major.size': 0.0,
          'xtick.minor.size': 0.0,
          'ytick.color': '.15',
          'ytick.direction': 'out',
          'ytick.major.size': 0.0,
          'ytick.minor.size': 0.0})
To set a style for the current session, do so with plt.style.use and reset to the default style with plt.style.use('default').
Completely Master Matplotlib
If you are interested in completely mastering matplotlib so that you can produce trusted results, take a look at my book Master Data Analysis with Python.

Top comments (3)
I used to keep a custom rcparams library readily available at all times. Makes it so easy to get plots looking good and consistent. It also gives them a bit of your personal brand.
Yes, thats a good idea. You can save style sheets in the matplotlib config directory and have them available at all times with just the name of the file. matplotlib.org/tutorials/introduct...
That is cool. I made it more complicated than it needed to be. I used rcParams