In "things you can do with a terminal emulator that renders images":
One way to look at a database's structure is as a graph of foreign key relationships among tables. Two styles of visual representation predominate: models or entity-relationship diagrams (ERDs) created as part of requirements negotiation and design, and descriptive diagrams of an extant database. The former are drawn by hand on a whiteboard or in diagramming software; the latter are often generated by database management tools with some manual cleanup and organization. Both styles usually take the complete database as their object, and whether descriptive or prescriptive, their role in the software development process is as reference material, or documentation.
Documentation isn't disposable. Even though these diagrams are out of date practically as soon as they're saved off, they take effort to make, or at least to make legible -- automated tools are only so good at layout, especially as table and relationship counts grow. That effort isn't lightly discarded, and anyway a diagram that's still mostly accurate remains a useful reference.
Documentation isn't disposable. But documentation isn't the only tool we have for orienting ourselves in a system: we can also explore, view the system in parts and from different angles, follow individual paths through the model from concept to concept. Exploration depends on adopting a partial, mobile perspective from the inside of the model, with rapid feedback and enough context to navigate but not so much as to be overwhelmed. The view from a single point is more or less important depending on the point itself, but in order to facilitate exploration that view has to be generated and discarded on demand. Look, move, look, move.
This is a partial perspective of the pagila sample database, from the table film:
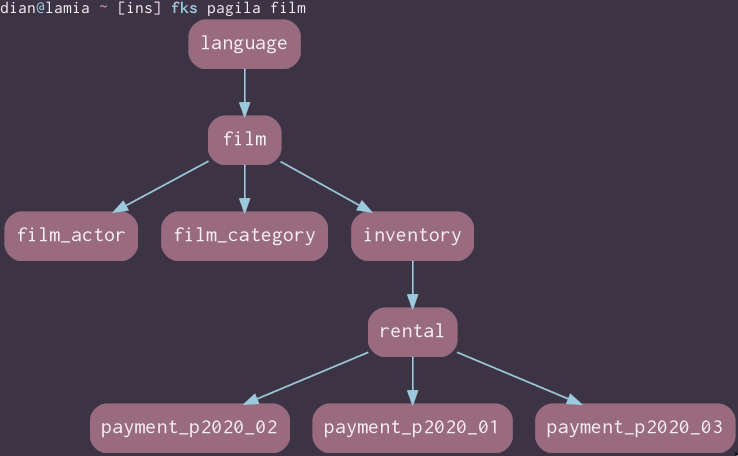
It's generated by this fks zsh function which queries Postgres' catalog of foreign keys using a recursive common table expression to identify and visualize everything connected in a straight line to the target. The query output is passed to the Graphviz suite's dot with a template, rendered to png, and the png displayed with wezterm imgcat. No files are created or harmed at any point in the process.
Why only a straight line, though? The graph above has obvious gaps: film_actor implies an actor, and film_category its own table on the other side of the junction. inventory probably wants a store, and rental and the payment tables aren't much use without a customer. The view from rental is markedly different, with half a dozen tables that weren't visible at all from film:
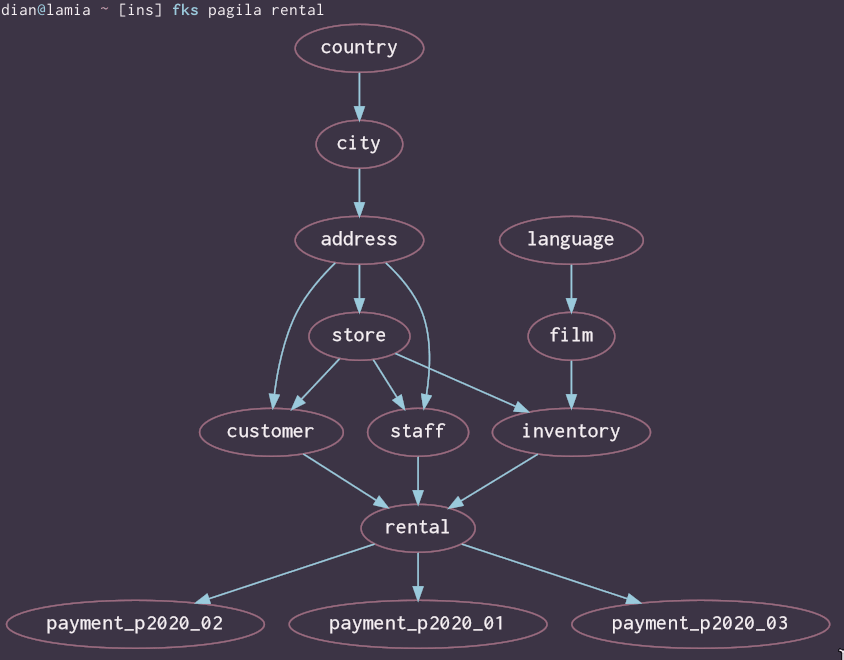
This graph is familiar in part: there's rental itself, the payment tables, inventory, film -- the last shorn of the junctions to the still-missing actor and category tables. Those have passed around a metaphorical corner, since in order to get from rental to film_actor you must travel first up foreign keys into film (via rental.inventory_id and inventory.film_id), then down by way of film_actor.film_id. language, meanwhile, is "upwards" of film and therefore remains visible from rental.
The reason fks restricts its search to straight lines from the target table is to keep context narrow. You can get a fuller picture of the table structure by navigating and viewing the graph from multiple perspectives; what fks shows is the set of tables which can affect the target, or which will be affected by changes in the target. If you delete a store or a film, rentals from that store or of that film are invalidated (and, unless the intermediary foreign keys are set to cascade, the delete fails). But deleting a film_actor has nothing to do with rental, and vice versa.
There's an actual, serious problem with unrestricted traversal, too. If you recurse through all relationships, you wind up mapping entire subgraphs, or clusters of related tables. And clusters grow quickly. Stuart Kauffman has a great illustration of the principle in his book At Home in the Universe: The Search for the Laws of Self-Organization and Complexity.
Imagine 10,000 buttons scattered on a hardwood floor. Randomly choose two buttons and connect them with a thread. Now put this pair down and randomly choose two more buttons, pick them up, and connect them with a thread. As you continue to do this, at first you will almost certainly pick up buttons that you have not picked up before. After a while, however, you are more likely to pick at random a pair of buttons and find that you have already chosen one of the pair. So when you tie a thread between the two newly chosen buttons, you will find three buttons tied together. In short, as you continue to choose random pairs of buttons to connect with a thread, after a while the buttons start becoming interconnected into larger clusters.
When the ratio of threads to buttons, or relationships to tables, passes 0.5, there's a phase transition. Enough clusters exist that the next thread or relationship will likely connect one cluster to another, and the next, and the next. A supercluster emerges, nearly the size of the entire relationship graph. We can see what the relationship:table ratio looks like in a database by querying the system catalogs:
WITH tbls AS (
  SELECT count(*) AS num FROM information_schema.tables
  WHERE table_schema NOT IN ('pg_catalog', 'information_schema')
), fks AS (
  SELECT count(*) AS num FROM pg_constraint WHERE contype = 'f'
)
SELECT
  fks.num AS f,
  tbls.num AS t,
  fks.num::decimal / tbls.num AS r
FROM tbls CROSS JOIN fks;
The lowest ratio I have in a real working database is 0.56, and it's a small one, with f=14 and t=25. Others range from 0.61 (f=78, t=126) all the way up to 1.96 (f=2171, t=1107 thanks to a heavily partitioned table with multiple foreign keys); pagila itself is in the middle at 1.08 (f=27, t=25). I don't have enough data to back this up, but I think it's reasonable to expect that the number of relationships tends to increase faster than the number of tables. Without restrictions on traversal, you might as well draw a regular ERD: superclusters are inevitable.
fks will draw a regular ERD if passed only the database name, but like I said earlier, automated tools are only so good at layout (and in a terminal of limited width, even a smallish database is liable to produce an illegibly zoomed-out model). With no way to add universal render hints, Graphviz does a lot better with the smaller, more restricted graphs from local perspectives inside the database -- and so do humans. Reading a full-scale data model is hard! Tens or hundreds of nodes have to be sorted by relevance to the problem at hand; nodes and relationships which matter have to be mapped, the irrelevant actively ignored, others tagged with a mental question mark. Often a given problem involves more relevant entities than the human mind can track unaided. fks doesn't resolve the issue completely, but making a database spatial and navigating that space visually goes some way to meet our limitations and those of our tools.

Top comments (0)