In this article, I want to share my experience on how to group rows in the Vuetify table by similar values.
While researching the topic I found out that there is not much information about grouping, of course, you can find basic grouping examples but for my use case, I needed a bit of advanced functionality.
A small introduction
Suppose we have products data. Its self-cost and quantity are differentiated by date. For example:
| Product name | Product code | Self-cost | Quantity | Process date |
|---|---|---|---|---|
| 🍌 Banana | 111222333 | 1.4 | 50 | 2021-09-09 |
| 🍌 Banana | 111222333 | 1.2 | 20 | 2021-09-10 |
| 🍌 Banana | 111222333 | 1.5 | 74 | 2021-09-11 |
| 🍎 Apple | 222111333 | 0.5 | 100 | 2021-09-09 |
| 🍎 Apple | 222111333 | 0.9 | 80 | 2021-09-10 |
| 🍉 Watermelon | 362272838 | 1.1 | 24 | 2021-09-10 |
| 🍉 Watermelon | 362272838 | 1 | 45 | 2021-09-11 |
| 🍉 Watermelon | 362272838 | 0.8 | 73 | 2021-09-12 |
Every day we've been receiving products but at different costs and quantities. We need such detailed data to analyze it but also it will be great if we can “fold“ or group similar products to get summarized information about them such as average self-cost, total cost and total quantity.
So, in this case, we need one meta or temporary row which will summarize previous similar data and display it.
Make things happen...
Suppose we have such a JavaScript snippet:
fields: [
    {value: 'product_name', text: 'Product name', sortable: true, groupable: true},
    {value: 'product_code', text: 'Product code', sortable: true, groupable: true},
    {value: 'quantity', text: 'Quantity', sortable: true, groupable: false},
    {value: 'produced_at', text: 'Process date', sortable: false, groupable: false},
],
items: [
    {
        "product_name": "🍌 Banana",
        "product_code": 111222333,
        "Self cost": 1.4,
        "Quantity": 50,
        "produced_at": "2021-09-09"
    },
    {
        "product_name": "🍌 Banana",
        "product_code": 111222333,
        "Self cost": 1.2,
        "Quantity": 20,
        "produced_at": "2021-09-10"
    },
    {
        "product_name": "🍌 Banana",
        "product_code": 111222333,
        "Self cost": 1.5,
        "Quantity": 74,
        "produced_at": "2021-09-11"
    },
    {
        "product_name": "🍎 Apple",
        "product_code": 222111333,
        "Self cost": 0.5,
        "Quantity": 100,
        "produced_at": "2021-09-09"
    },
    {
        "product_name": "🍎 Apple",
        "product_code": 222111333,
        "Self cost": 0.9,
        "Quantity": 80,
        "produced_at": "2021-09-10"
    },
    {
        "product_name": "🍉 Watermelon",
        "product_code": 362272838,
        "Self cost": 1.1,
        "Quantity": 24,
        "produced_at": "2021-09-10"
    },
    {
        "product_name": "🍉 Watermelon",
        "product_code": 362272838,
        "Self cost": 1,
        "Quantity": 45,
        "produced_at": "2021-09-11"
    },
    {
        "product_name": "🍉 Watermelon",
        "product_code": 362272838,
        "Self cost": 0.8,
        "Quantity": 73,
        "produced_at": "2021-09-12"
    }
],
And we feed our HTML with the above data:
<v-app>
    <v-data-table :headers="fields"
                  :items="items"
                   class="elevation-1 bordered"
                   group-by="product_code"
                   show-group-by>
         ...
    </v-data-table>
</v-app>
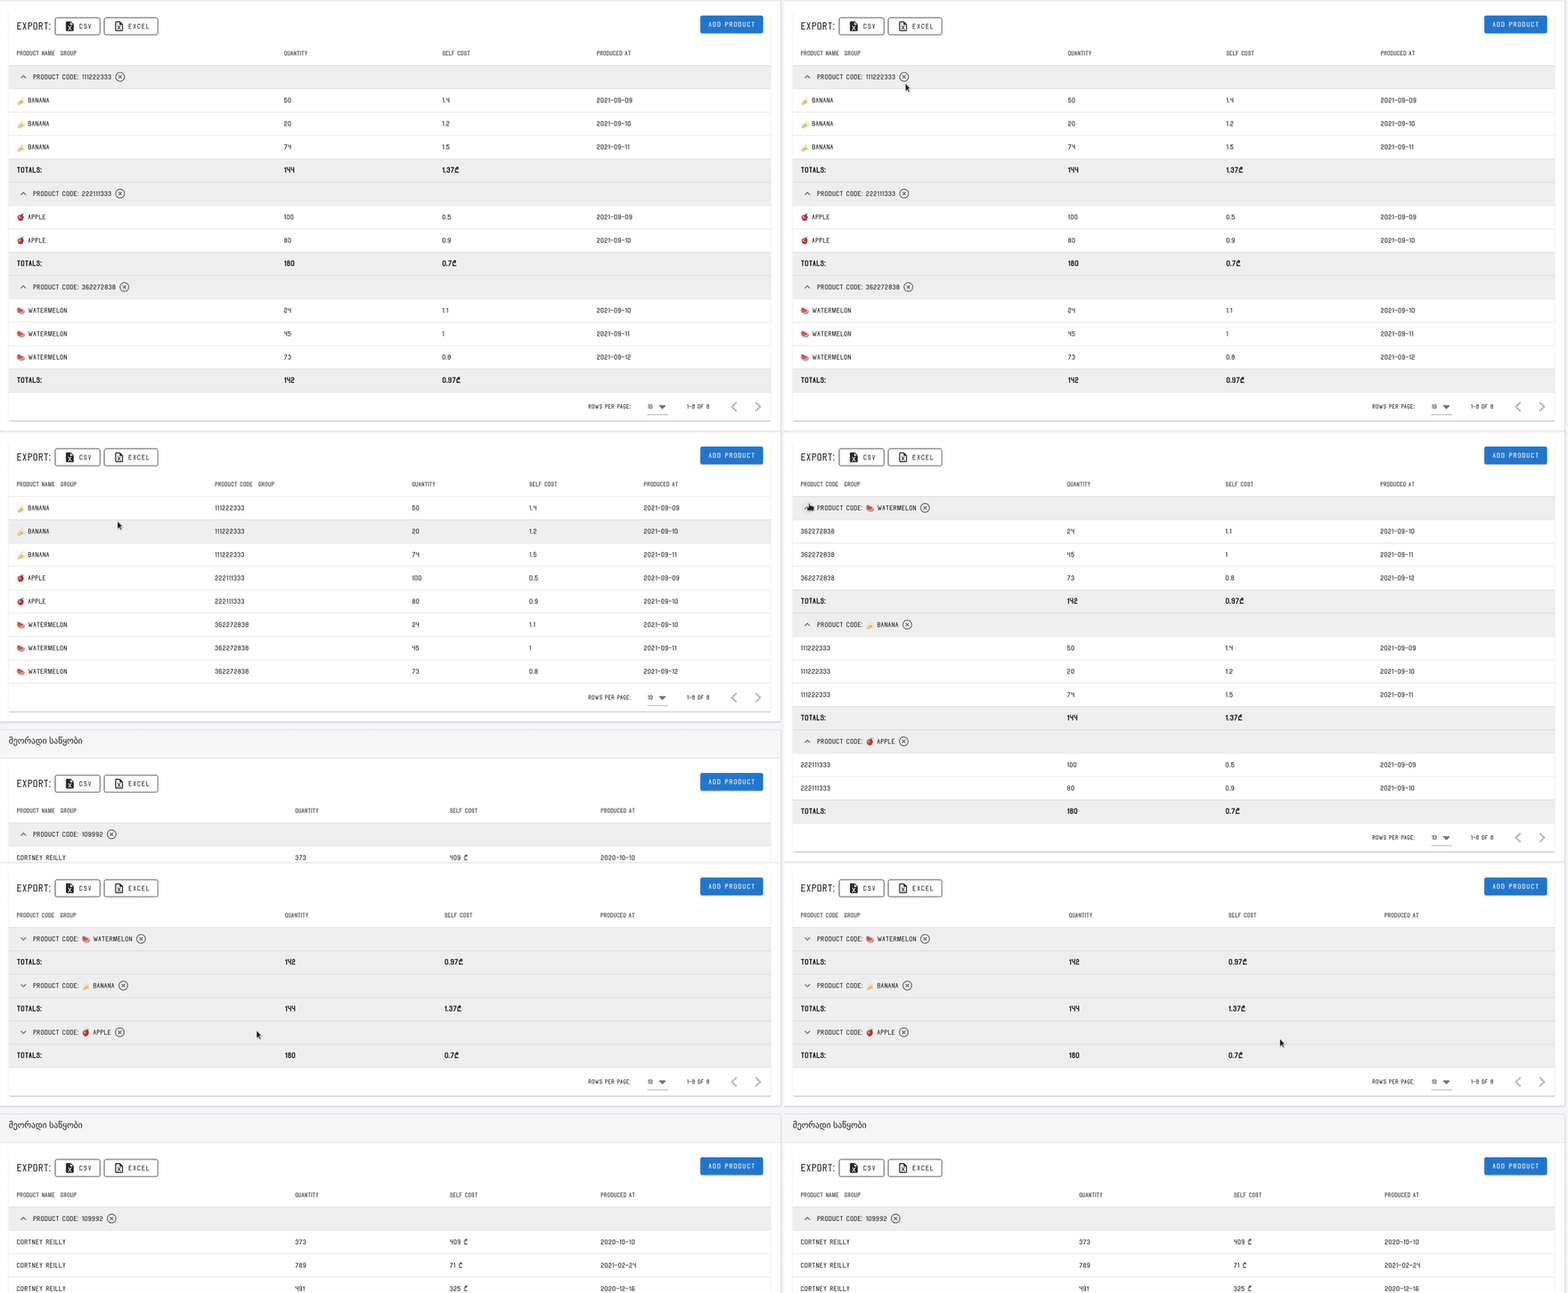
So we get something like this:
Cool right? We can group by product name and product code, as well as disable grouping to view everything at a glance. But what if we want to summarize some columns' data, for example, calculate the average self cost for bananas, apples and watermelons or sum up the quantities?
Vuetify provides us with a great and well-documented API. For grouping customization, we need to look into the group.summary slot which has the following parameters:
{
  group: string,
  groupBy: string[],
  isMobile: boolean,
  items: any[],
  headers: DataTableHeader[],
  isOpen: boolean,
  toggle: () => void
}
In our case, we can pull the items array by destructuring it from the above object.
<template #group.summary="{ items }">
    <th class="totals">Totals:</th>
    <th class="totals">{{ calculateTotals(items).total_quantity }}</th>
    <th class="totals">{{ calculateTotals(items).average_self_cost }}</th>
    <th class="totals"></th>
</template>
From here, we now have control over all the data we need and can modify it as needed.
The final version of our HTML will look like this:
<v-app>
    <v-data-table :headers="fields"
                  :items="items"
                   class="elevation-1 bordered"
                   group-by="product_code"
                   show-group-by>
             <template #group.summary="{ items }">
                <th class="totals">Totals:</th>
                <th class="totals">{{ calculateTotals(items).total_quantity }}</th>
                <th class="totals">{{ calculateTotals(items).average_self_cost }}</th>
                <th class="totals"></th>
             </template>
    </v-data-table>
</v-app>
And what it looks like:
We can view "unique" products by minimizing similar rows and we see summary data at the glance. Such summary information will be very useful when we have a large dataset like 100-250 rows.
As an improvement, we can add a toggle that folds identical data at once for the displayed rows instead of manually doing this and viewing statistical numbers much faster.
I hope you liked this article and got something new from it.
Footnote
This is my first article so be strict. ✌🏻
Any suggestions are appreciated.
And thank you for reading up to this.


Top comments (0)