
Introduction
In the previous article, we went over how to update Cypress to its amazing version 10! Now we’ll finish off this series by adding code coverage to our application and incorporating it into our CI. But what is code coverage?
Code coverage is a software testing metric that determines the number of lines of code that is successfully validated under a test procedure, which in turn, helps in analyzing how comprehensively a software is verified. Source
In most cases, this is a percentage of how much the codebase is being covered by tests. How do we know if a test covers a certain amount of code? Instrumentation of our code monitors and traces the test coverage and gives us accurate reports.
Cool! First, let’s go over what our application does. When clicking on a button it fetches posts from a service and displays them on the page:
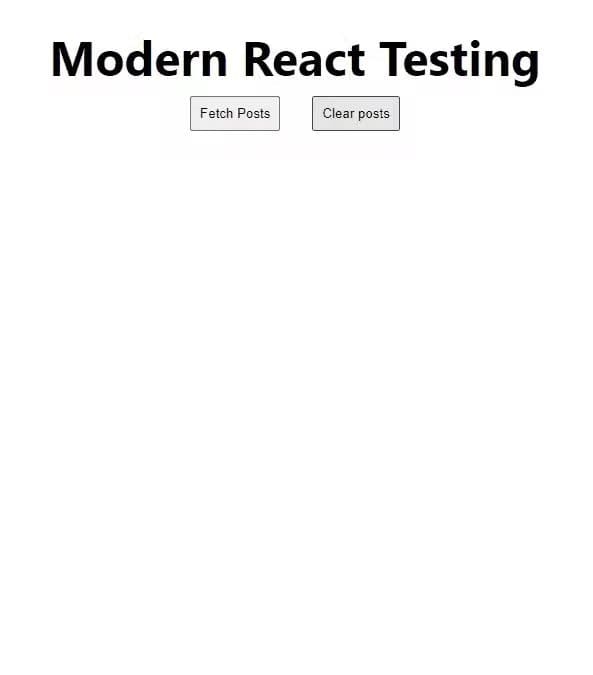
For reference, you can find the repository here.
Installing codecov
We will be using Codecov
Ship healthier code faster with less risk.
That’s their motto! But how do we go about using it? In the link above make sure to make an account and connect your repository.
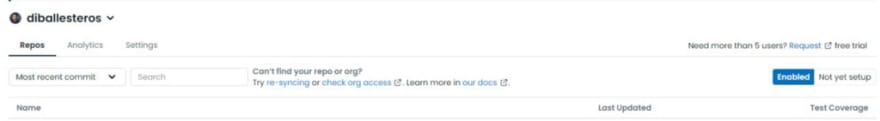
In the Not yet setup tab we should find our repository.
This will give us some brief instructions on how to set up code coverage with our repository. First, let’s install a necessary Cypress package:
npm install @cypress/code-coverage --save-dev
Then in our cypress/support/e2e.js file let's go ahead and import this new code.
In our cypress.config.js we also have to set up the events to correctly execute the code coverage:
const { defineConfig } = require('cypress');

module.exports = defineConfig({
    e2e: {
        baseUrl: 'http://localhost:3000',
        specPattern: 'cypress/integration/**/*.spec.js',
        setupNodeEvents(on, config) {
            require('@cypress/code-coverage/task')(on, config);
            return config;
        },
    },
});
Let’s open up our application and cypress to run our test:
npm run dev

npm run test-e2e
When we run our test we will see the following command:
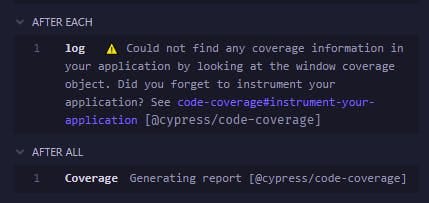
What we’re missing is the instrumentation for our code. There are a few ways to go about this. But first, let’s add the two new folders to our .gitignore:
# Code coverage files
coverage
.nyc_output
To instrument our code we have to install the following plugin:
npm install vite-plugin-istanbul --save-dev
In our vite.config.js we should import the newly installed library and set it up:
Some interesting notes on how the Istanbul plugin works can be found here.
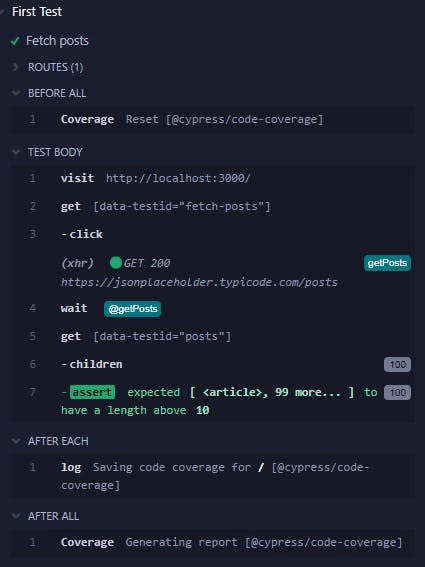
Finally, when we run the rest we’ll no longer see the same warning as before:
To get a better understanding of what’s going on let’s take a look at the root directory you’ll see a folder, coverage:
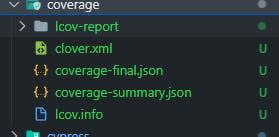
You’ll see some JSON files that detail exactly what is covered in the files of the directory we provided earlier in the vite.config.js (./src).
Wrapping it up
Instrumenting our code base is crucial to providing Codecov with the necessary information it needs to give us the percentage of code coverage we actually have.
In the next article, I’ll go over how to set up the GitHub Action to automatically send the code coverage report to CodeCov with every push. This way you don’t have to think about it at all!
You can find the full code here at this repo.
Let’s Connect
If you liked this feel free to connect with me on LinkedIn or Twitter
Check out my free developer roadmap and weekly tech industry news in my newsletter.

Top comments (0)