The article was originally published on Blogspot on April 24, 2013
When we get an OOM (out of memory) error, we should try and understand what is going on inside the JVM. The best way to do that is a heap dump. The general idea is to dump out the contents of the JVM’s memory into a file, then analyse it using a tool.
An OOM simply means that the JVM ran out of memory. When this occurs, we basically have 2 choices:
- Allow the JVM to use more memory i.e. increase the –Xmx. But the question is till what extent?
- Improve/Fix the application so that it uses less memory. A memory leak happens when the application keeps more and more references to objects and never releases them. The garbage collector will therefore never collect those objects. At this point, the JVM will throw an OOM. To solve this issue, we first need to find the root cause of it.
Java has a built-in feature for dumping heap snapshots called HeapDump.
What is a heap dump?
A heapdump as the name suggests is a dump of the heap. It will allow us to navigate the heap and see what objects use all the heap memory and which are the ones that still keep a reference on them, and so on and so forth. This probably will give us very strong hints and we will (hopefully) be able to find the root cause of the problem. A heap dump is a snapshot of the memory of a Java process at a certain point of time. There are different formats for persisting this data, and depending on the format it may contain different pieces of information, but in general the snapshot contains information about the java objects and classes in the heap at the moment the snapshot was triggered. HeapDump for servers can provide view into the memory profile of application at the time it crashed can help us figure out what caused the error.
What Are Heap Dumps Good for?
- If there is a system which is crashing sporadically with an OutOfMemoryError.
-
If you want to analyse what the footprint into memory of your application is, then heap dumps are again a good choice to find/analyse:
- Leak Suspects: includes leak suspects and a system overview.
- Top Components: list reports for components bigger than 1 percent of the total heap.
- Histogram: Lists number of instances per class.
- Dominator Tree: List the biggest objects and what they keep alive.
- Top Consumers: Print the most expensive objects grouped by class and by package.
- Duplicate Classes: Detect classes loaded by multiple class loaders.
Types of Heap Dumps
- Binary Heap Dumps (HPROF - produced by Sun, HP, SAP, etc… JVMs) Java has a built-in feature for dumping heap snapshots to files in HPROF binary format.
- IBM System Dumps
- IBM Portable Heap Dumps (PHD)
⚠️ This article is restricted to HPROF format only.
How To Get a Heap Dump (HPROF snapshots can be created in the following ways):
-
Automatically when OutOfMemory occurs: Since JDK 1.5, it has built-in mechanism to help debug pesky out-of-memory errors which is to set the below parameter and get the heap dump whenever out of memory occurs:
- -XX:+HeapDumpOnOutOfMemoryError - Dumps heap to file when java.lang.OutOfMemoryError is thrown.
- Start the application with the VM argument:
- -XX:+HeapDumpOnOutOfMemoryError
- -XX:HeapDumpPath= C:/opt/tomcat/current/logs. (This will tell the VM to produce a heap dump when an OOM occurs) By default the heap dump file is placed into the VM base directory but introducing -XX:HeapDumpPath , we can provide a custom location. This location can be shared one so that we can take the file and analyse it using any tool.
- Explicitly via jmap utility (Sun Java 6): Sun Java 6 has the jmap utility that allows to connect to running Java process and dump Java heap:
jmap -dump:format=b,file=file_name.hprof
(Hint: to learn the PID (process identifier) of running JVM, you can use jps or jconsole JDK utilities.)
The benefit is that memory can be analyzed on demand with no additional configuration of JVM or Java application. You can dump memory of any running instance of JVM that supports this feature.
- Explicitly via jconsole utility (Sun Java 6)

Sun Java has the jconsole utility that lets you to connect to a running Java 6 process for monitoring and management.
Using jconsole, you can dump Java heap via HotSpotDiagnostic MBean
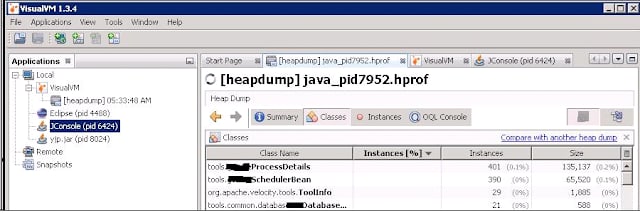
Analyze Heap Dump using API
Use a tool such as YourKit, VisualVM, MAT or jhat to analyze the heapdump (the name of the dump file is in format: java_pidXXXX.hprof) file.
Example Usage:
The sample profiler screenshot showed 10 "BIGGEST OBJECTS" and it seems all are containing a same String Object wrapped up. Biggest object size is around 100 MB and rest 9 follow it.


Top comments (0)