
(banner: top 100 tags, proportional to their number of articles)
I am on dev.to for a while now, and I couldn't help noticing that most of the featured articles I see are web development related (javascript, webdev), or targeted at beginners (beginners, basic git commands, etc.).
I wrote a few articles, that I consider not that bad (well, not that great either), but they don't seem to take. Might it be because I am not writing about the things the community cares about?
Instead of staying in the dark, I tried to better understand what works and doesn't work on dev.to. Here is a summary of my analysis.
Disclaimer
I am not a data scientist and did this in my spare time. I tried my best to stay unbiased and to clearly explain what I am doing, so you can see the potential biases and pitfalls.
The complete analysis with interactive graphs can be found at https://derlin.github.io/dev.to-is-for-web-devs-and-beginners/analysis.html
The full code is available on GitHub:
 derlin
/
dev.to-is-for-web-devs-and-beginners
derlin
/
dev.to-is-for-web-devs-and-beginners
Analysis of the tags that work on dev.to. Full article: https://dev.to/derlin/devto-is-for-webdevs-and-beginners-i-have-data-to-prove-it-54c4
dev.to is for web developers and beginners, I have data to prove it
This repository contains the source code of one of my dev.to articles that analyses which tags are the most popular on dev.to.
The data collection was done on November, 13 2022 at 18:52, so the data may have changed since then !
Analysis ⮕ https://derlin.github.io/dev.to-is-for-web-devs-and-beginners/analysis.html
Article ⮕ https://dev.to/derlin/devto-is-for-webdevs-and-beginners-i-have-data-to-prove-it-54c4
 (Top 200 tags appearing most often on the top 10,000 articles of all time)
IMPORTANT: the notebooks do not show graphs in GitHub preview
To preview them, please go to
https://derlin.github.io/dev.to-is-for-web-devs-and-beginners/ instead.
Disclaimer
I am not a data scientist and did this on my spare time I didn't have much time to invest, but I tried my best to stay unbiased and to clearly explain what I am doing, so you can see the potential biases and pitfalls.
Feel free to run it yourself, improve it…
Feel free to run it yourself, improve it, and share your results ! (Just mention my work if you write about it somewhere, and 🌟 the repo :)).
Collected data
Dimensions
I am mainly interested in four dimensions:
- the kind of article (tags),
- the number of articles (count),
- the number of positive reactions (reactions), and
- the number of comments (comments).
There are many other properties available for an article (read time, published time, etc), but I kept them aside for now.
Datasets
I gathered two different datasets using Python on November, 13 2022.
top articles
The first dataset contains the top (i.e. with the most positive reactions) 10,000 articles of all time, gathered using the https://dev.to/search/feed_content endpoint:
count=1
curl "https://dev.to/search/feed_content?class_name=Article&per_page=$count&sort_by=public_reactions_count&sort_direction=desc"
top tags
The second dataset contains the top 100 tags. For each tag, I gathered the total number of articles and the top 100 articles.
Getting the top tags can be done using the forem API:
curl https://dev.to/api/tags?per_page=100&page=0
Or by scrapping the page https://dev.to/tags.
The two methods however do NOT return the same results... As the API returned 4 nonexistant tags (404 Not Found for macosapps, southafricanews, sportnews, and latestnigerianewslat), I settled on scraping the https://dev.to/tags page.
There is no API endpoint to get the number of articles per tag, but they are displayed in two places on dev.to ("XXX posts published"):
- on the tags page https://dev.to/tags, and
- on each tag page
https://dev.to/t/<TAG>
The problem is, they don't match at all, (1) being often way higher than (2).
For example, at the time of writing, the archlinux tag shows "34635 posts published" on the tags page, but "151 Posts Published" on the https://dev.to/t/archlinux page... To settle this, I scrolled until there was no more new fetch, and got 181 articles.
I thus decided to rely on the number found on the tag pages (2).
ⓘ For more information on the discrepancies, see https://derlin.github.io/dev.to-is-for-web-devs-and-beginners/difference.html.
Finally, the top articles per tag can be fetched using the same https://dev.to/search/feed_content endpoint, with just an extra parameter:
count=1
# the separator is ', ', so ',%20' when url-encoded
tags_query_param='&tag_names[]=javascript,%20webdev'

curl "https://dev.to/search/feed_content?class_name=Article&per_page=$count&sort_by=public_reactions_count&sort_direction=desc&$tags_query_param"
Top tags
The 100 tags listed on https://dev.to/tags at the time of writing are:
More than 30K articles:
  javascript (67K), webdev (55K), beginners (43K)

Between 20K-30K articles:
  tutorial, react, programming

Between 10K-20K articles:
  python, discuss, productivity, css, career, node,
  devops, codenewbie

Between 5K-10K articles:
  html, opensource, typescript, aws, showdev, github, java,
  testing, docker, php, security, linux, vue, ruby, git

Between 2K-5K articles:
   angular, go, database, dotnet, csharp, serverless,
   machinelearning, kubernetes, rails, computerscience,
   cloud, android, design, laravel, azure, api, algorithms,
   architecture, help, learning, datascience, vscode,
   reactnative, graphql, frontend, nextjs, flutter,
   watercooler, django, ios, codepen, sql, rust,
   todayilearned, blockchain, performance

Between 1K-2K articles:
   hacktoberfest, startup, kotlin, motivation, news, coding,
   challenge, mongodb, development, microservices,
   tailwindcss, postgres, cpp, npm, ux, gamedev, wordpress,
   writing, devjournal, mobile, dart, leetcode, ai, agile,
   firebase, management, tooling, meta, braziliandevs, mysql

Less than 1K articles:
  web3, community, cybersecurity, actionshackathon21, archlinux
Let's plot the number of articles (count), reactions and comments for those 100 tags, ordered by count.
As we don't have the total number of reactions or comments available on dev.to, they are taken from the sum of the top 100 articles for each tag.
IMPORTANT: remember that an article can have up to four tags, so a very popular article can boost the scores of multiple tags!
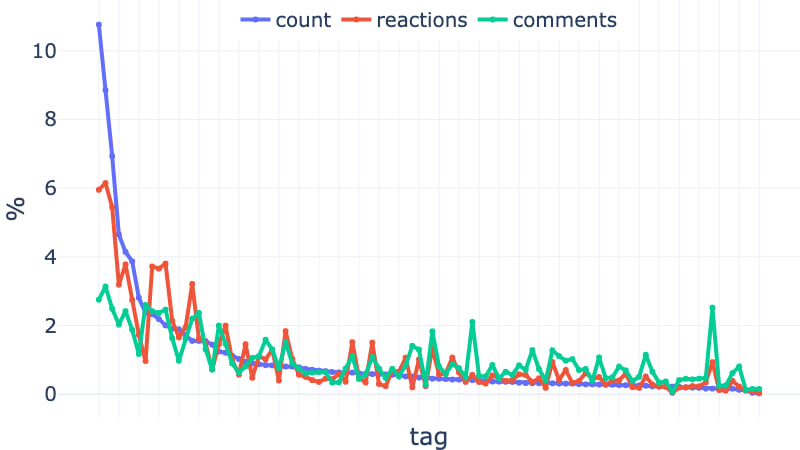
(interactive version and interactive version without normalization)
We can see that the first few tags account for most of the articles. The reactions and comments follow roughly the same trend, with high peaks and drops. Let's zoom in on the first 30 tags:
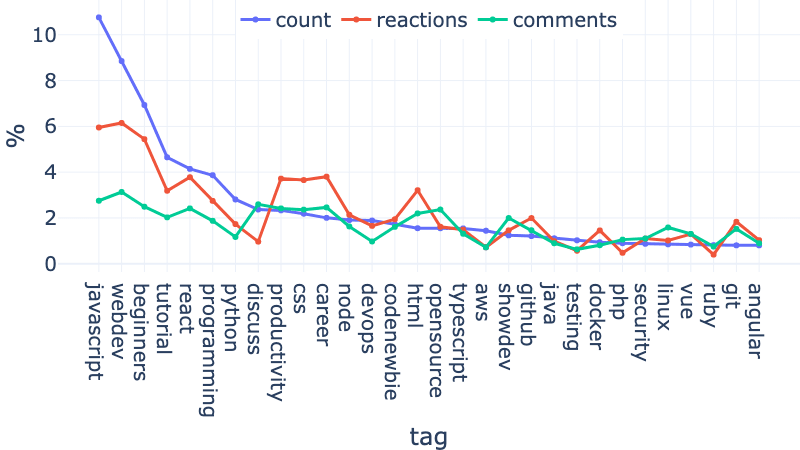
Taking only the first 4 tags, we account for 30% of all the articles of the top 100 tags: javascript (10.76%), webdev (8.85%), beginners (6.93%), tutorial (4.65%) → 31.10%!
Looking at the peaks and drops of reactions on the full graph, some types of tags clearly generate "reaction peaks":
- web-related tags such as:
react,css,html,vscode,vue,frontend... - generic tags such as:
productivity,career,computerscience,design,architecture,learning,motivation... -
github,git, anddocker, which are basic tools any (web) developer should know
On the other hand, some groups of tags show clear "reaction drops":
- languages/framework not web-related:
php,ruby,android,laravel,kotlin, ... - devops subjects:
devops,cloud,aws,azure, ... -
datascienceandtesting(← this one was unexpected)
The top 100 articles of the top 7 tags account for 30% of all the positive reactions in the dataset: webdev (6.15%), javascript (5.95%), beginners (5.44%), career (3.80%), react (3.78%), productivity (3.72%), css (3.66%) → 32.5%.
From the comments point of view, some obvious tags have a high peak: discuss, watercooler, meta, writing, help, showdev. I am not surprised to also see peaks for tags like career or productivity. vscode has a huge comment bump, I guess because it is the editor of choice for web developers (and IDEs are sacred). I am astonished to see many comments generated by linux and opensource.
Similar to reactions, tags for languages/frameworks not web-related or devops-focus have fewer comments: python, devops, aws, testing, machinelearning, kubernetes, aws, datascience, ...
Top 10,000 articles of all time
The data from the tags dataset has many flaws: the count is not guaranteed to be accurate, and the reactions and comments can only be inferred using the top 100 articles, which is far from ideal. So let's look at the top 10,000 articles of all time instead.
Note: the oldest article in the dataset is from April 2016, the latest from November 2022, with a distribution that is quite even along those two extremes. So it isn't just old articles!
As articles have multiple tags, let's "explode" the dataset, so an article with 4 tags gives rise to 4 lines (one for each tag). Then, let's group lines by tag. The distribution of count (number of articles), reactions, and comments are:
| count | reactions | comments | |
|---|---|---|---|
| mean | 21 | 7024 | 439 |
| std | 192 | 67,768 | 3,719 |
| min | 1 | 122 | 0 |
| 25% | 1 | 175 | 12 |
| 50% | 1 | 335 | 29 |
| 75% | 4 | 1,012 | 88 |
| max | 4,515 | 1,631,495 | 89,391 |
(out of 1,676 tags)
See the difference between the 75% quartile in the max? There are again a small number of tags that gather most of the attention!
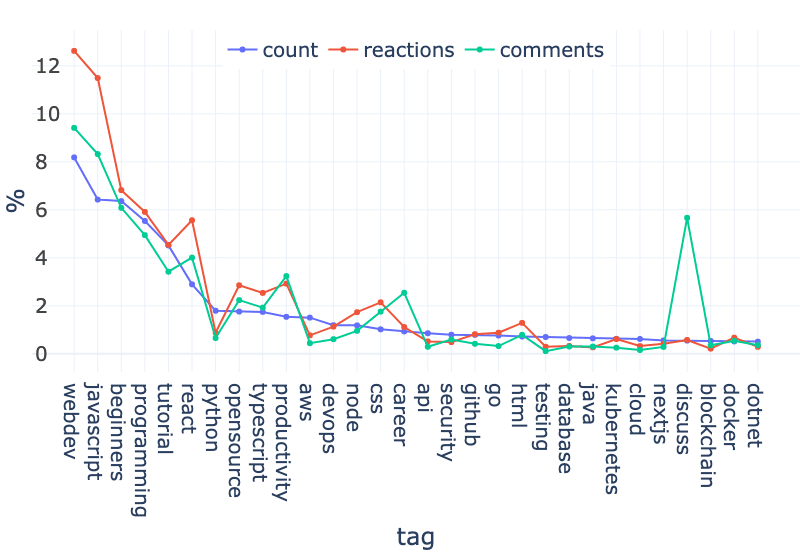
Here are the top 25 tags (normalized to show percentages across the whole dataset):

(interactive version and interactive version without normalization)
The first 7 tags, webdev, javascript, beginners, react, tutorial, productivity, career and css account for 53% of the articles, 48% of the comments, and 56% of the reactions!
But there is still a little problem. Since articles have up to four tags, a very successful article will boost the scores of multiple tags...
So instead, let's count articles only once. That is, if an article has multiple tags, we will keep only the most "successful" one, that is the one with the highest value for count, reactions, or comments (depending on the criterion under analysis).
Using a normalized cumulative sum, this is what we get for the number of articles:
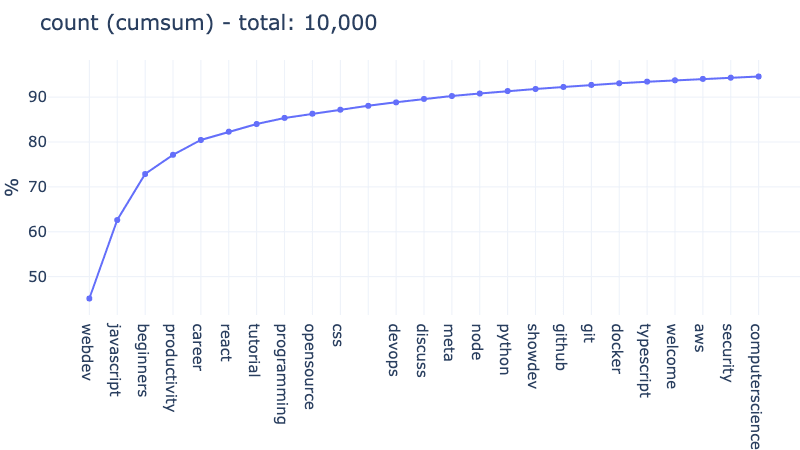
webdev and javascript cover 62% of the articles (6K out of 10K)! Adding only beginners, productivity, and career cover 80%.
The same trend can be seen for reactions (66% for webdev and javascript, 84% adding the 3 other tags):

For comments, we just have the welcome tag that inserts itself in the 3rd place. The rest of the top 6 is left mostly unchanged:

bonus: Top 5,000 articles of the last month
The oldest the article, the higher its opportunity to have gained traction. Maybe the trend has changed since the beginning of dev.to ?
To ensure the conclusions based on the top articles dataset is correct, I reran the analysis notebook using a slightly modified top articles dataset: the top 5K articles between October, 16 and November, 16 2022.
Note that I tried to add a I ran it on November, 16 and used the following query parameter: to get the articles in the last month.How I fetched the data
I haven't committed the results, but you can get similar data yourself by adding a published_at[gte]=<isodate> parameter to the https://dev.to/search/feed_content query.
published_at[lte] parameter as well, but it doesn't seem to work...
published_at%5Bgte%5D=2022-10-16T06%3A52%3A04Z
Here are the top 25 tags that appear in this new dataset (out of 1,487):
(Tags of the top 5K articles between Oct, 16 and Nov, 16)
Counting articles only once, 60% of the top articles of last month are covered by: webdev (23.92%), <no tag> (14.12%), beginners (9.94%), javascript (8.38%), programming (5.50%) → 61.86%.
60% of the reactions on the top articles of last month are covered by: webdev (43.91%), javascript (10.68%), beginners (8.35%) → 62.93%.
Finally, 60% of the comments are covered by: webdev (29.01%), discuss (15.12%), welcome (9.66%), javascript (9.31%) → 63.10%.
There is not much change in the trend compared to the top 10K articles of all time, except for a rise of articles without any tags.
Conclusion
However we look at it, webdev, javascript and beginners are by far the most prolific tags on dev.to. They account for more than 50% of the top 10K articles of all time, and have more comments and positive reactions than any other tag.
webdev alone covers 12% of the 10K top articles of all time, 20% of the top 5K articles of last month.
Just after, we find tags like productivity and career, which also take a big part of the cake.
Looking at other successful tags, we find mostly webdev-related tags (react, vscode, etc), beginner-friendly tags (codenewbie, tutorial, etc), and generic tags (programming, opensource, etc).
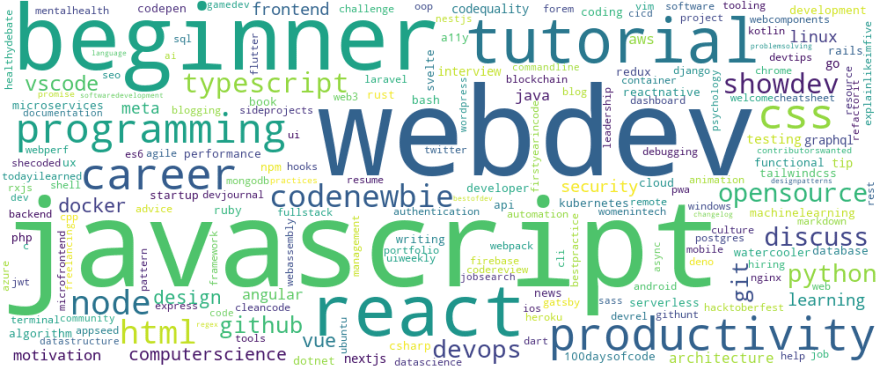
(tag cloud based on the tags appearing in the top 10K articles on dev.to)
More specific tags (not webdev-related) are also present in the top articles, but represent a small proportion and have in general fewer interactions.
Weaker assertions
For the rest, the trend is fuzzier, as results from the top tags dataset and the top articles datasets do not always match.
After staring at the data for a while (especially the top tags datasets), my feeling is that "successful" articles on dev.to are mostly:
- web development and web framework articles,
- beginner articles for "newbies",
- generic articles for productivity and career / tips and tricks,
- generic articles on coding (programming, computer science),
- technologies and tools that are used by all developers, but especially web devs (docker, git, github, vs code).
While other languages (especially compiled ones) and frameworks that web developers do not use on a daily basis or more advanced topics are fewer / trigger less reactions and comments (kotlin, php, devops, datascience, machine learning, ...).
In other words, if you are not a web developer and like to write highly technical articles, it may be hard to shine on dev.to (this doesn't mean you shouldn't contribute!)
This is just my analysis though, and maybe you will disagree after staring yourself at the full analysis. Let me know in the comments !


Oldest comments (36)
I've noticed this too. Hackernews tends to have a more advanced backend/systems focus. While dev is mostly react and ts/js. I wish dev drew more interest from the backend/systems types because that's what I am more interested in and I like dev as a platform more than hackernews. Reddit is probably my favorite because it's a nice mix of everything.
I agree ! They launched community.ops.io a while back, but it is really focused on devsecops, not much room for backend devs either.
Can you recommend some subreddits?
It depends on what you're into. /r/rust /r/linux /r/nixos /r/programming /r/unixporn and /r/neovim are some of my favorites.
For real
Nice job with the numbers ;)
I think we all know that, it was even discussed around last community survey, I think. And while I don't mind not being in mainstream (although it does not exactly encourage to write), I don't love association webdev == javascript, like nothing else exists.
What about medium.com?
Medium has amazing content, but I dislike the limited access and the writing experience is awful. Having to use gists to get proper code formatting is soo annoying!
Medium is for a general purpose, dev is more related to programming.
Interesting analysis. Some posts in popular tags may touch upon the tag topic just enough to avoid tag removal by tag moderators, but are mostly about something else. Someone a while back posted about their strategies to reach more readers, and suggested including some connection in posts to webdev or javascript based on tag. I disagree with that strategy because ultimately it may just annoy those who do read it expecting something else. But if many use that approach, then popular tags become more popular due to their popularity.
This post isn't the one I was thinking of, but includes a quote related: "for nearly any article the #webdev tag is likely to fit": dev.to/grahamthedev/it-is-possible...
That is a good point, and I also strongly disagree with this technique. I used it for the first time on this post, but it was more for the joke.
Please, do not use this article to pick the best tags for your articles, just keep writing and tagging what you love!
@derlin and @ben Can't the DEV.to team add something like a "priority tag" or "main-focus tag" to lift say Vue, Laravel, Node, Go or any other #tags out?
Like a high-lighter the post writer can use.
Yes it's about web dev, but it's Laravel-based and even more so Lumen microservice-based, discussing GraphQL API interfaces and using Vue for example?
And even use the order of the sub-tags from most relevant to least relevant to the specific post.
We can see the beginners tags daily, and this data prove it. Good job!
Great analysis, not a surprising outcome ... I've bookmarked this article, but more for the techniques that you used to do the analysis than for the results per se.
Yes, obviously (but you proved it) dev.to is heavily skewed towards beginners, webdev, JS/CSS/HTML, React (I mean React is also HUGE on dev.to) ...
Then when you say "web dev" you overwhelmingly say 'frontend' ... and when you say frontend React is dominant, 'vanilla JS' is there, CSS is popular, stuff like Vue, Angular, much less so.
And if you say "backend" then most of the time you say "node.js" - a bit Python too, much less Ruby/Rails, PHP/Laravel, Golang, Rust etc.
I haven't thought of it this way, very good points! The new expertise level features may help improve a bit the feed, let's see.
Since you work(ed) at dev.to, any idea about the discrepancies we see in the "XXX posts published" on the top tags vs tag page? I am curious.
The more complex the article the fewer people have the resources to spare for reading and understanding it. It is much easier to write a short tutorial for beginners than a high level white paper. It is easier to do webdev and understanding it just by reading than other dev work.
All this is very normal. The only improvement I see is to focus on highlighting quality rather than reads and likes.
Great job!
you forgot that it is also for spambots
There is a lot of great information on this site for beginners.
What sites are focused on backend then?
Very interesting research!
Thanks for collecting, analyzing and sharing! Some thoughts after a quick look at your findings:
After reading your post, I am even less interesting in the results of the upcoming State of JavaScript and StackOverflow survey results and what our profession's apparent mainstream seems to care about.
My own conclusion, as a web developer who once was a beginner: trying to learn and discuss something new and focus (even more) on the less popular hashtags when choosing what to write about in the future.
I am still not sure about the consequences and importance of the findings. Is it a bad thing, that DEV is for beginners and web developers? Does the popularity of these topics mean that there is nothing else, and if there is, can we filter topics and create bubbles of interest, if we want to?
I am guilty of using popular topics to gain more attention, writing some posts for beginners, and writing more about JavaScript than I would otherwise have done would it not be that popular. I also tried other deceptive patterns like including upcoming years ("for 2022") or emojis in the title, or watiting for a specific "lucky" time to release, holding back content instead of releasing immediately. While some of that might actually have helped, I would not follow that path any further.
So, besides JavaScript, what else will I possibly want to share and discuss? I already wrote about PHP, Linux, networking (both social networking between human beings, attending meetups, recommending coworking cafés, and solving problems connecting computers to local WiFi networks and the internet), career, and sustainability. I also engaged in the meta discussion about DEV, Mastodon, Twitter, and other social networks. I even wrote about "Web3", which I am mostly skeptical about, but I always want to be fair and open minded.
What else does your list of less popular hashtags has to offer?
After reading your post again and again, I come to the conclusion, that we should not take quantitative analytics too seriously. Just like most people seem to celebrate football (soccer), baseball, cricket, or whatever is the mainstream sports spectacle in your culture, we do not need to care just because everyone else does.
I don't think it is a bad thing, and hope my readers didn't take it this way. My main goal was to reassure writers like myself who write about other topics that they shouldn't interpret the lack of reaction (compared to other articles) as solely a judgment on quality. You got ten readers or a couple reactions on a more backend post? Celebrate it and keep going, that is amazing given the trend!
I also hope this post will inspire some to "rebel" against this, by participating more on less trendy topics.
I would be so happy to re-run the analysis in a year, and see a different, more balanced curve. You seem to be one of them, thank you!
This is the right attitude!
I will!