
Why do I need it at all
There are many ways to include a map in your website or application: Google Maps, Mapbox, Leaflet etc. It's simple. Some services allows you to do it in just few clicks.
But it's getting bad when you need to customise the design, display some dataset or do whatever you want. Moreover, in Vue or React you can't use JSX and have to use imperative abstract javascript API (but I use Vue because I'm very excited by templates and reactivity).
Also some libraries are not free for private projects.
So once again I had to display some data on map I decided: I want full control in my code and I will create my own map with blackjack and hookers.
Step 1: Create a static map.
Let's start with simple vue-cli 3 app with Babel and sass.
We need D3 and d3-tile (it doesn't included in d3 npm package) for rendering map tiles.
yarn add d3 d3-tile
Actually we don't need whole d3 code. For a simple map we only need d3-geo for map projection and d3-tile for generating tiles, so we will include only these packages.
Next we should define some settings like scale, width, height and initial coordinates. Usually I make all my charts responsive to it container by calculating element's size on mount.
<script>
const d3 = {
  ...require('d3-geo'),
  ...require('d3-tile'),
};

export default {
  props: {
    center: {
      type: Array,
      default: () => [33.561041, -7.584838],
    },
    scale: {
      type: [Number, String],
      default: 1 << 20,
    },
  },
  data () {
    return {
      width: 0,
      height: 0,
    };
  },
  mounted () {
    const rect = this.$el.getBoundingClientRect();

    this.width = rect.width;
    this.height = rect.height;
  },
  render () {
    if (this.width <= 0 || this.height <= 0) {
      // the dummy for calculating element size
      return <div class="map" />;
    }

    return (
      <div class="map">our map will be here</div>
    );
  },
};
</script>

<style lang="scss" scoped>
.map {
  width: 100%;
  height: 100%;
}
</style>
Now define the projection and tiles generator.
export default {
  // ...
  computed: {
    projection () {
      return d3.geoMercator()
        .scale(+this.scale / (2 * Math.PI))
        .translate([this.width / 2, this.height / 2])
        .center(this.center)
      ;
    },
    tiles () {
      return d3.tile()
        .size([this.width, this.height])
        .scale(+this.scale)
        .translate(this.projection([0, 0]))()
      ;
    },
  },
  // ...
};
I always define d3 helper functions as computed properties, so when some params are changing Vue recalculates them and updates our component.
Now we have everything needed for displaying the map and we just render generated tiles:
export default {
  render () {
    if (this.width <= 0 || this.height <= 0) {
      return <div class="map" />;
    }

    return (
      <div class="map">
        <svg viewBox={`0 0 ${this.width} ${this.height}`}>
          <g>
            {this.tiles.map(t => (
              <image
                key={`${t.x}_${t.y}_${t.z}`}
                class="map__tile"
                xlinkHref={`https://a.tile.openstreetmap.org/${t.z}/${t.x}/${t.y}.png `}
                x={(t.x + this.tiles.translate[0]) * this.tiles.scale}
                y={(t.y + this.tiles.translate[1]) * this.tiles.scale}
                width={this.tiles.scale}
                height={this.tiles.scale}
              />
            ))}
          </g>
        </svg>
      </div>
    );
  },
};
Here we go through tiles generated by d3-tile and request images from tile server.
You can find other servers here or you can even host your own tile server with custom styles.
Don't forget to add a copyright.
<div class="map__copyright">
©
<a
href="https://www.openstreetmap.org/copyright"
target="_blank"
>OpenStreetMap </a>
contributors
</div>
.map {
  // ...
  position: relative;
  font-family: Arial, sans, sans-serif;

  &__copyright {
    position: absolute;
    bottom: 8px;
    right: 8px;
    padding: 2px 4px;
    background-color: rgba(#ffffff, .6);
    font-size: 14px;
  }
}
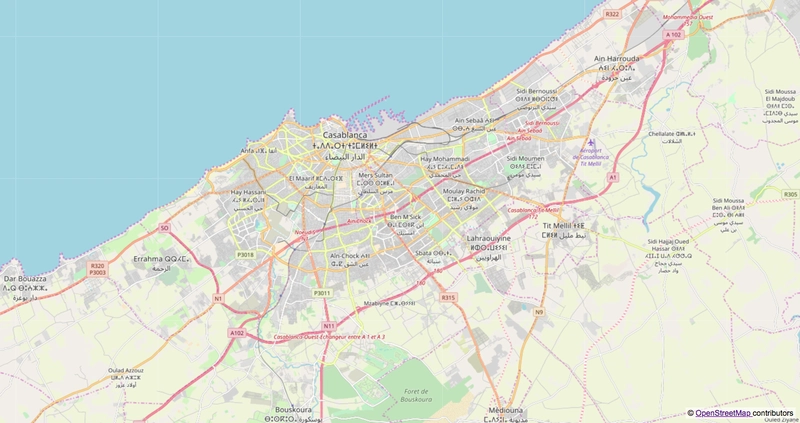
Now we have the static map of Casablanca. Not very exciting yet.
Step 2: Add map controls.
The most exciting thing for me is how Vue makes simpler the way to create an interactive map. We just update projection params and map updates. It was like easy peasy magic at first time!
We'll make zoom buttons and position control by dragging the map.
Let's start with dragging. We need to define projection translate props in component data and some mouse event listeners on svg element (or you can listen them on tiles group).
<script>
// ...

export default {
  // ...
  data () {
    return {
      // ...
      translateX: 0,
      translateY: 0,

      touchStarted: false,
      touchLastX: 0,
      touchLastY: 0,
    };
  },
  computed: {
    projection () {
      return d3.geoMercator()
        .scale(+this.scale / (2 * Math.PI))
        .translate([this.translateX, this.translateY])
        .center(this.center)
      ;
    },
    // ...
  },
  mounted () {
    // ...
    this.translateX = this.width / 2;
    this.translateY = this.height / 2;
  },
  methods: {
    onTouchStart (e) {
      this.touchStarted = true;

      this.touchLastX = e.clientX;
      this.touchLastY = e.clientY;
    },
    onTouchEnd () {
      this.touchStarted = false;
    },
    onTouchMove (e) {
      if (this.touchStarted) {
        this.translateX = this.translateX + e.clientX - this.touchLastX;
        this.translateY = this.translateY + e.clientY - this.touchLastY;

        this.touchLastX = e.clientX;
        this.touchLastY = e.clientY;
      }
    },
  },
  render () {
    // ...
    return (
      <div class="map">
        <svg
          viewBox={`0 0 ${this.width} ${this.height}`}
          onMousedown={this.onTouchStart}
          onMousemove={this.onTouchMove}
          onMouseup={this.onTouchEnd}
          onMouseleave={this.onTouchEnd}
        >
          // ...
        </svg>
        // ...
      </div>
    );
  },
};
</script>

<style lang="scss" scoped>
.map {
  // ...

  &__tile {
    // reset pointer events on images to prevent image dragging in Firefox
    pointer-events: none;
  }
  // ...
}
</style>
Wow! We just update translate values and new tiles are loading so we can explore the world. But it isn't very comfortable to do without a zoom control, so let's implement it.
We need to move scale prop in component's data, add zoom property and render zoom buttons.
In my experience minimal and maximum tile's zoom level are 10 and 27 (honestly I'm not very sure that this correct for all tile providers).
<script>
// ...

const MIN_ZOOM = 10;
const MAX_ZOOM = 27;

export default {
  props: {
    center: {
      type: Array,
      default: () => [-7.584838, 33.561041],
    },
    initialZoom: {
      type: [Number, String],
      default: 20,
    },
  },
  data () {
    return {
      // ...
      zoom: +this.initialZoom,
      scale: 1 << +this.initialZoom,
    };
  },
  // ...
  watch: {
    zoom (zoom, prevZoom) {
      const k = zoom - prevZoom > 0 ? 2 : .5;

      this.scale = 1 << zoom;
      this.translateY = this.height / 2 - k * (this.height / 2 - this.translateY);
      this.translateX = this.width / 2 - k * (this.width / 2 - this.translateX);
    },
  },
  // ...
  methods: {
    // ...
    zoomIn () {
      this.zoom = Math.min(this.zoom + 1, MAX_ZOOM);
    },
    zoomOut () {
      this.zoom = Math.max(this.zoom - 1, MIN_ZOOM);
    },
  },
  render () {
    // ...
    return (
      <div class="map">
        <div class="map__controls">
          <button
            class="map__button"
            disabled={this.zoom >= MAX_ZOOM}
            onClick={this.zoomIn}
          >+</button>
          <button
            class="map__button"
            disabled={this.zoom <= MIN_ZOOM}
            onClick={this.zoomOut}
          >-</button>
        </div>
        //...
      </div>
    );
  },
};
</script>

<style lang="scss" scoped>
.map {
  // ...
  &__controls {
    position: absolute;
    left: 16px;
    top: 16px;
    display: flex;
    flex-direction: column;
    justify-content: space-between;
    height: 56px;
  }
  &__button {
    border: 0;
    padding: 0;
    width: 24px;
    height: 24px;
    line-height: 24px;
    border-radius: 50%;
    font-size: 18px;
    background-color: #ffffff;
    color: #343434;
    box-shadow: 0 1px 4px rgba(0, 0, 0, .4);

    &:hover,
    &:focus {
      background-color: #eeeeee;
    }

    &:disabled {
      background-color: rgba(#eeeeee, .4);
    }
  }
  // ...
}
</style>
Here it is. In just two steps we created simple interactive map with Vue, D3 and OpenStreetMap.
Conclusion
It isn't hard to create your own map view component with the power of D3 and Vue's reactivity. I think that one of the most important things is the full control of DOM instead of using some abstract map renderer's API which will do some obscure things with my lovely elements.
Of course to make a good powerful map we need to implement more features like smooth zoom, max bounds etc. But all the stuff is fully customisable so you can do everything you want or need to do.
If you'll find this article useful I can write more about how to improve this map and display a data on it.
Please feel free to ask your questions.

Top comments (7)
Hi
Is there any possibility to create map/tiles from my own image? I have few antique maps so my idea is create maps based on scans of those maps with 2 or maybe 3 level of zoom. Is it possible at all? If yes - where to find some solution - script, library or something like this.
Hi. Sounds interesting. I don't have such experience, but have a look at this. Seems like there are some solutions based on Mapnik
Thx, it looks promising
Nice tutorial. Thank you.
It would be interesting to hear, why one should use d3 for this and not, e.g. openlayers?
OpenLayers is a complex tool like other libraries for displaying maps. They are provides many features for you, but they are not flexible and doesn't fit jsx or vue templates. Instead of writing templates you have to draw your map in mounted hook, redraw it on some updates and you haven't control on DOM at all.
I think it's the same as compare Angular 1/2 with React/Vue. D3 just provides you very helpful functions and then you can do whatever you want: render data by jsx, render data using plain js, or even render it as svg string in nodejs.
Also my next step was to display some data on map as circles with text inside it. And funny thing is I can draw a circle using (e.g.) Leaflet, but I can't render a text. Leaflet just doesn't provides API to do it.
Thanks for the elaboration. I am asking because I am very new to this whole geoinformation topic and I stumbled into it with my current project, where I was confronted with the task of making a mapcentric frontend. There we are using d3 already as a graphing / charting library - so using some geo plugins would seem a good fit - but for the map part, our engineers decided to go with open layers and up until now it seemed to be the go to tool of choice.
Our client is built with vuejs - which is where I come in to play ;) - and yes, you are right, that I am mostly building a facade to the open layers api and leave the rest to it.
Besides dealing the first time with openlayers, it is the first time for me to deal with d3 too.
Although I see it's potential - you could create everything you want to- it feels a bit like a bag of nuts and bolts to me - if you want to do that shiny x you have to built it yourself; here is your bag now have fun.
So I am considering, whether it is worth going down the road of ditching openlayers and doing everything in d3 (not for the current project, but as a reminder for upcoming projects). The upside is, that you could leave every quirk of openlayers behind. The downside is, that you - at least for the first project - have a big ramp up to get working facade code to emulate the functionality of openlayers for simply adding a new layer with e.g. WFS data etc. on the fly.
But thanks for your insight :]
Love